wandb-tui: Comparing W&B Runs Without Leaving the Terminal
A terminal dashboard for comparing Weights & Biases runs straight from a project URL — built for remote and cloud runs where the local wandb/ directories do not exist, and for the terminal you are already in.
When a training run lives on a cluster you SSH into, checking on it means switching to a browser, finding the project, and waiting for a web dashboard to render — all to answer a question like “did the loss diverge yet.”
wandb-tui answers that question in the terminal you are already in. It takes a Weights & Biases project or run URL and gives you a dashboard: tables, overlaid charts, grouping, filtering.
uvx wandb-tui 'https://wandb.ai/<entity>/<project>' --runs 8No install, no clone, no local run directory.
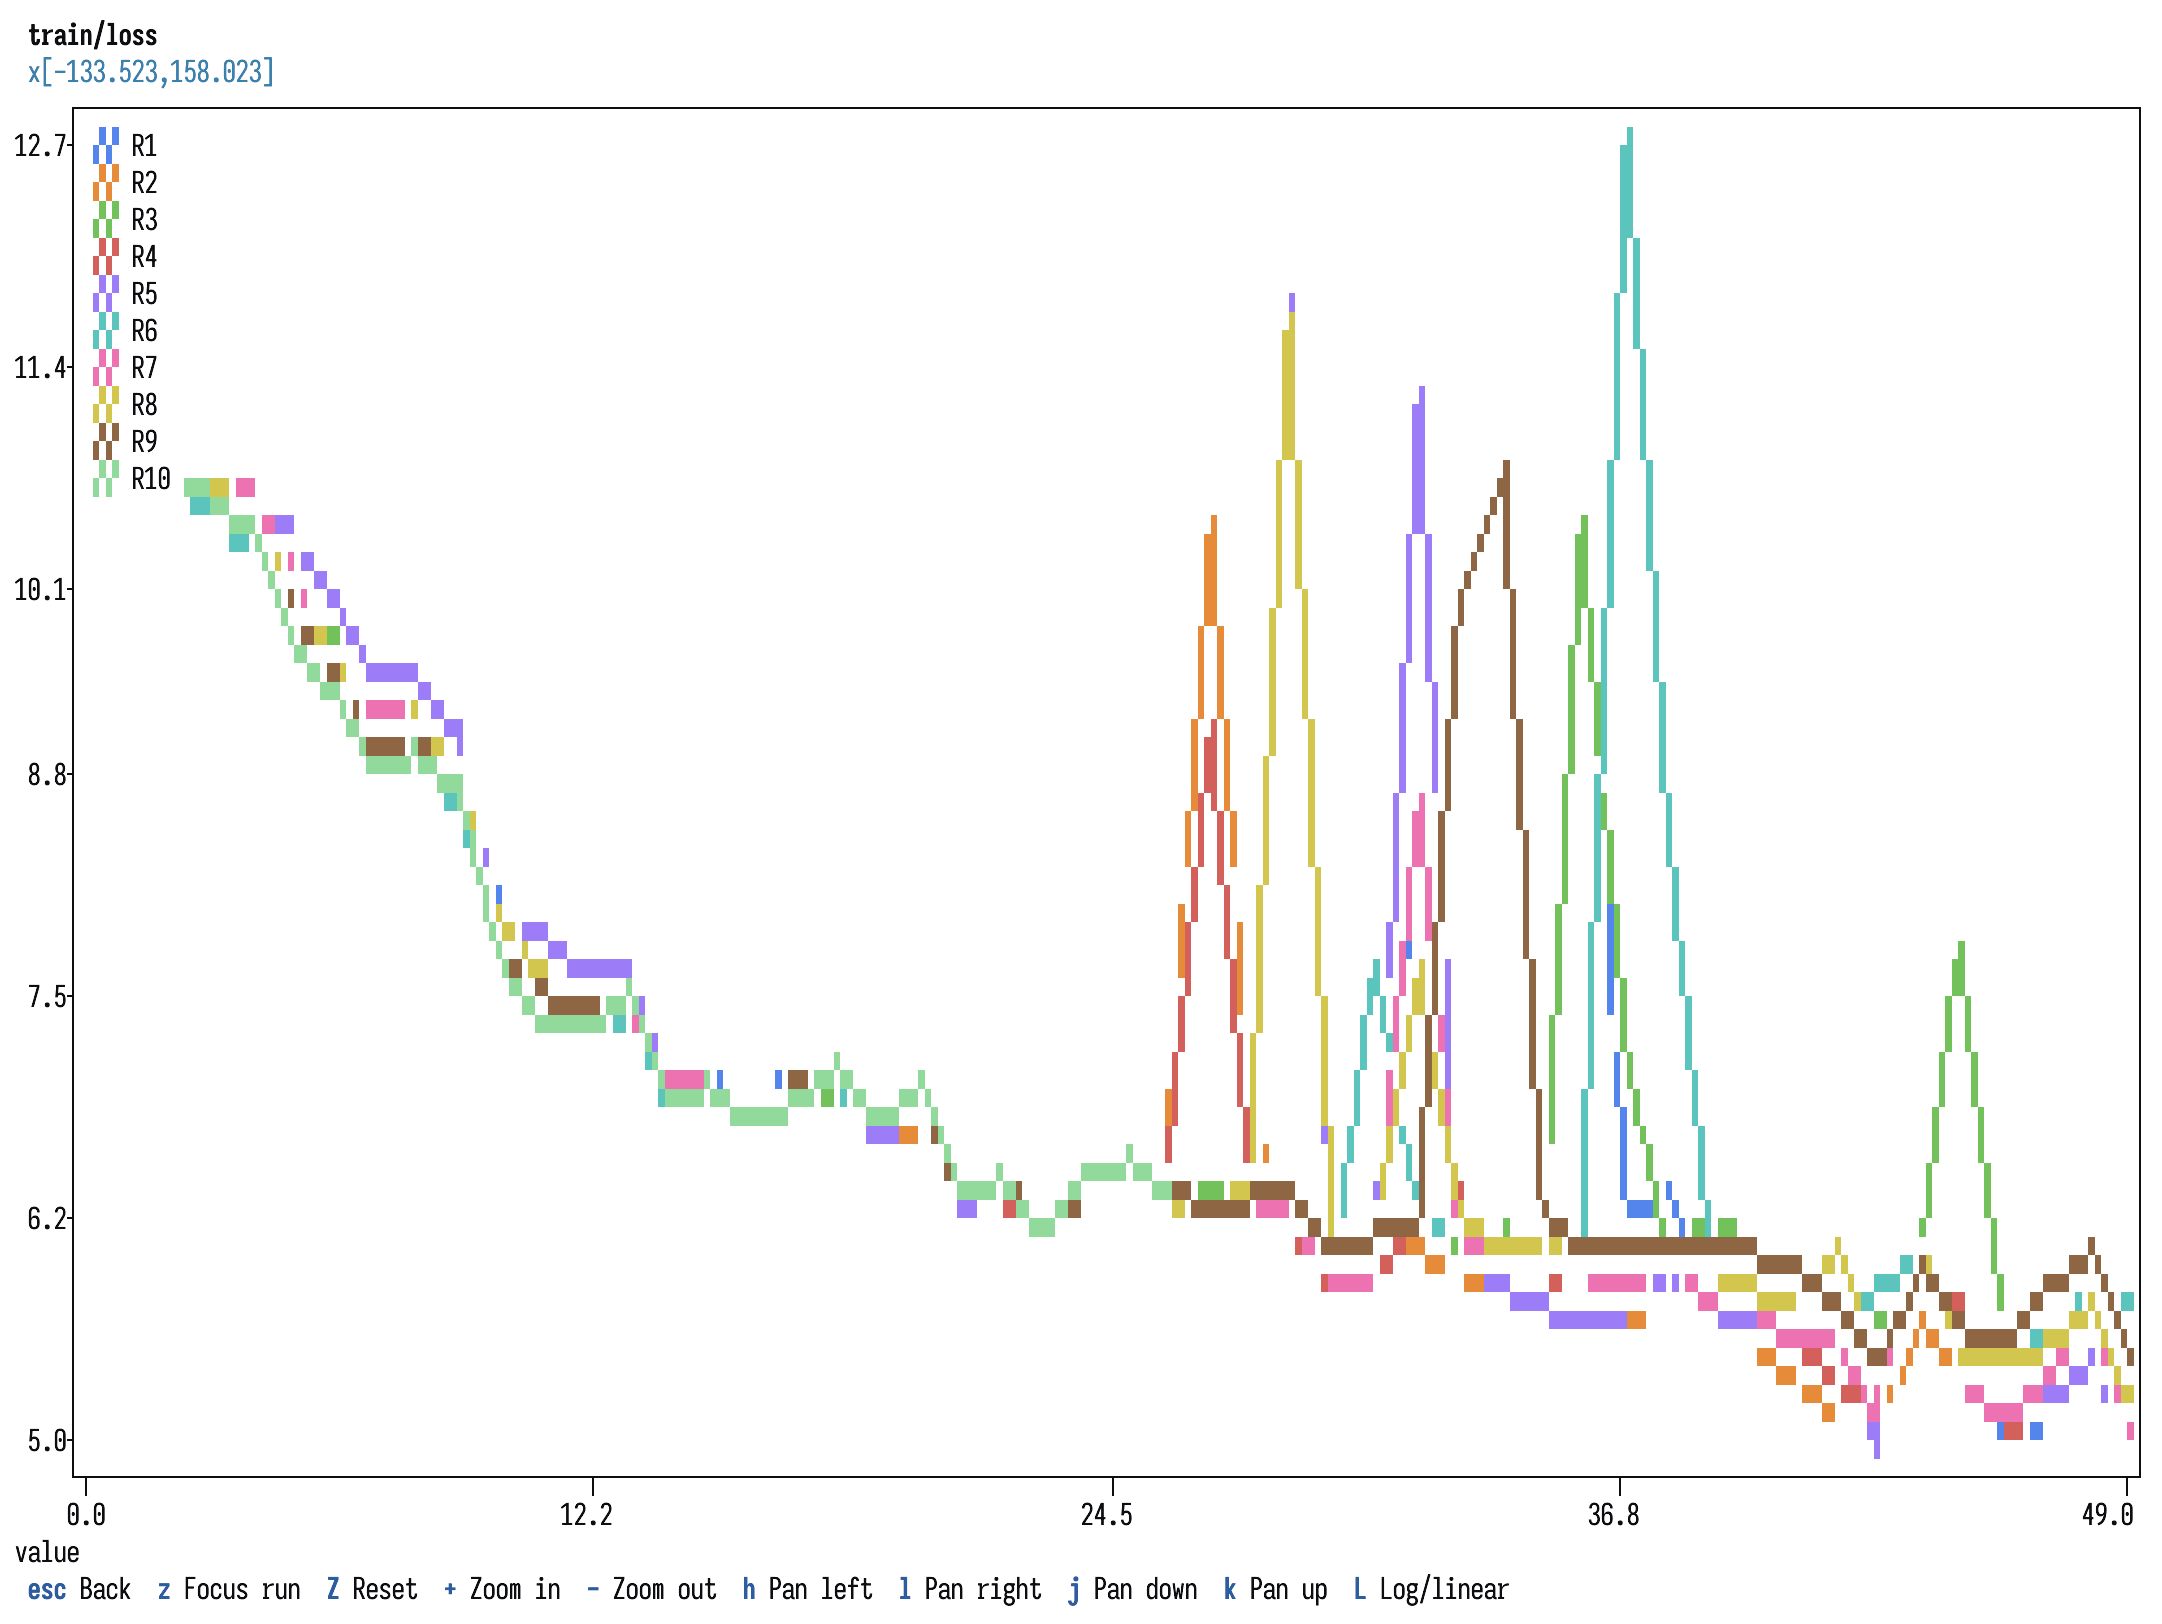
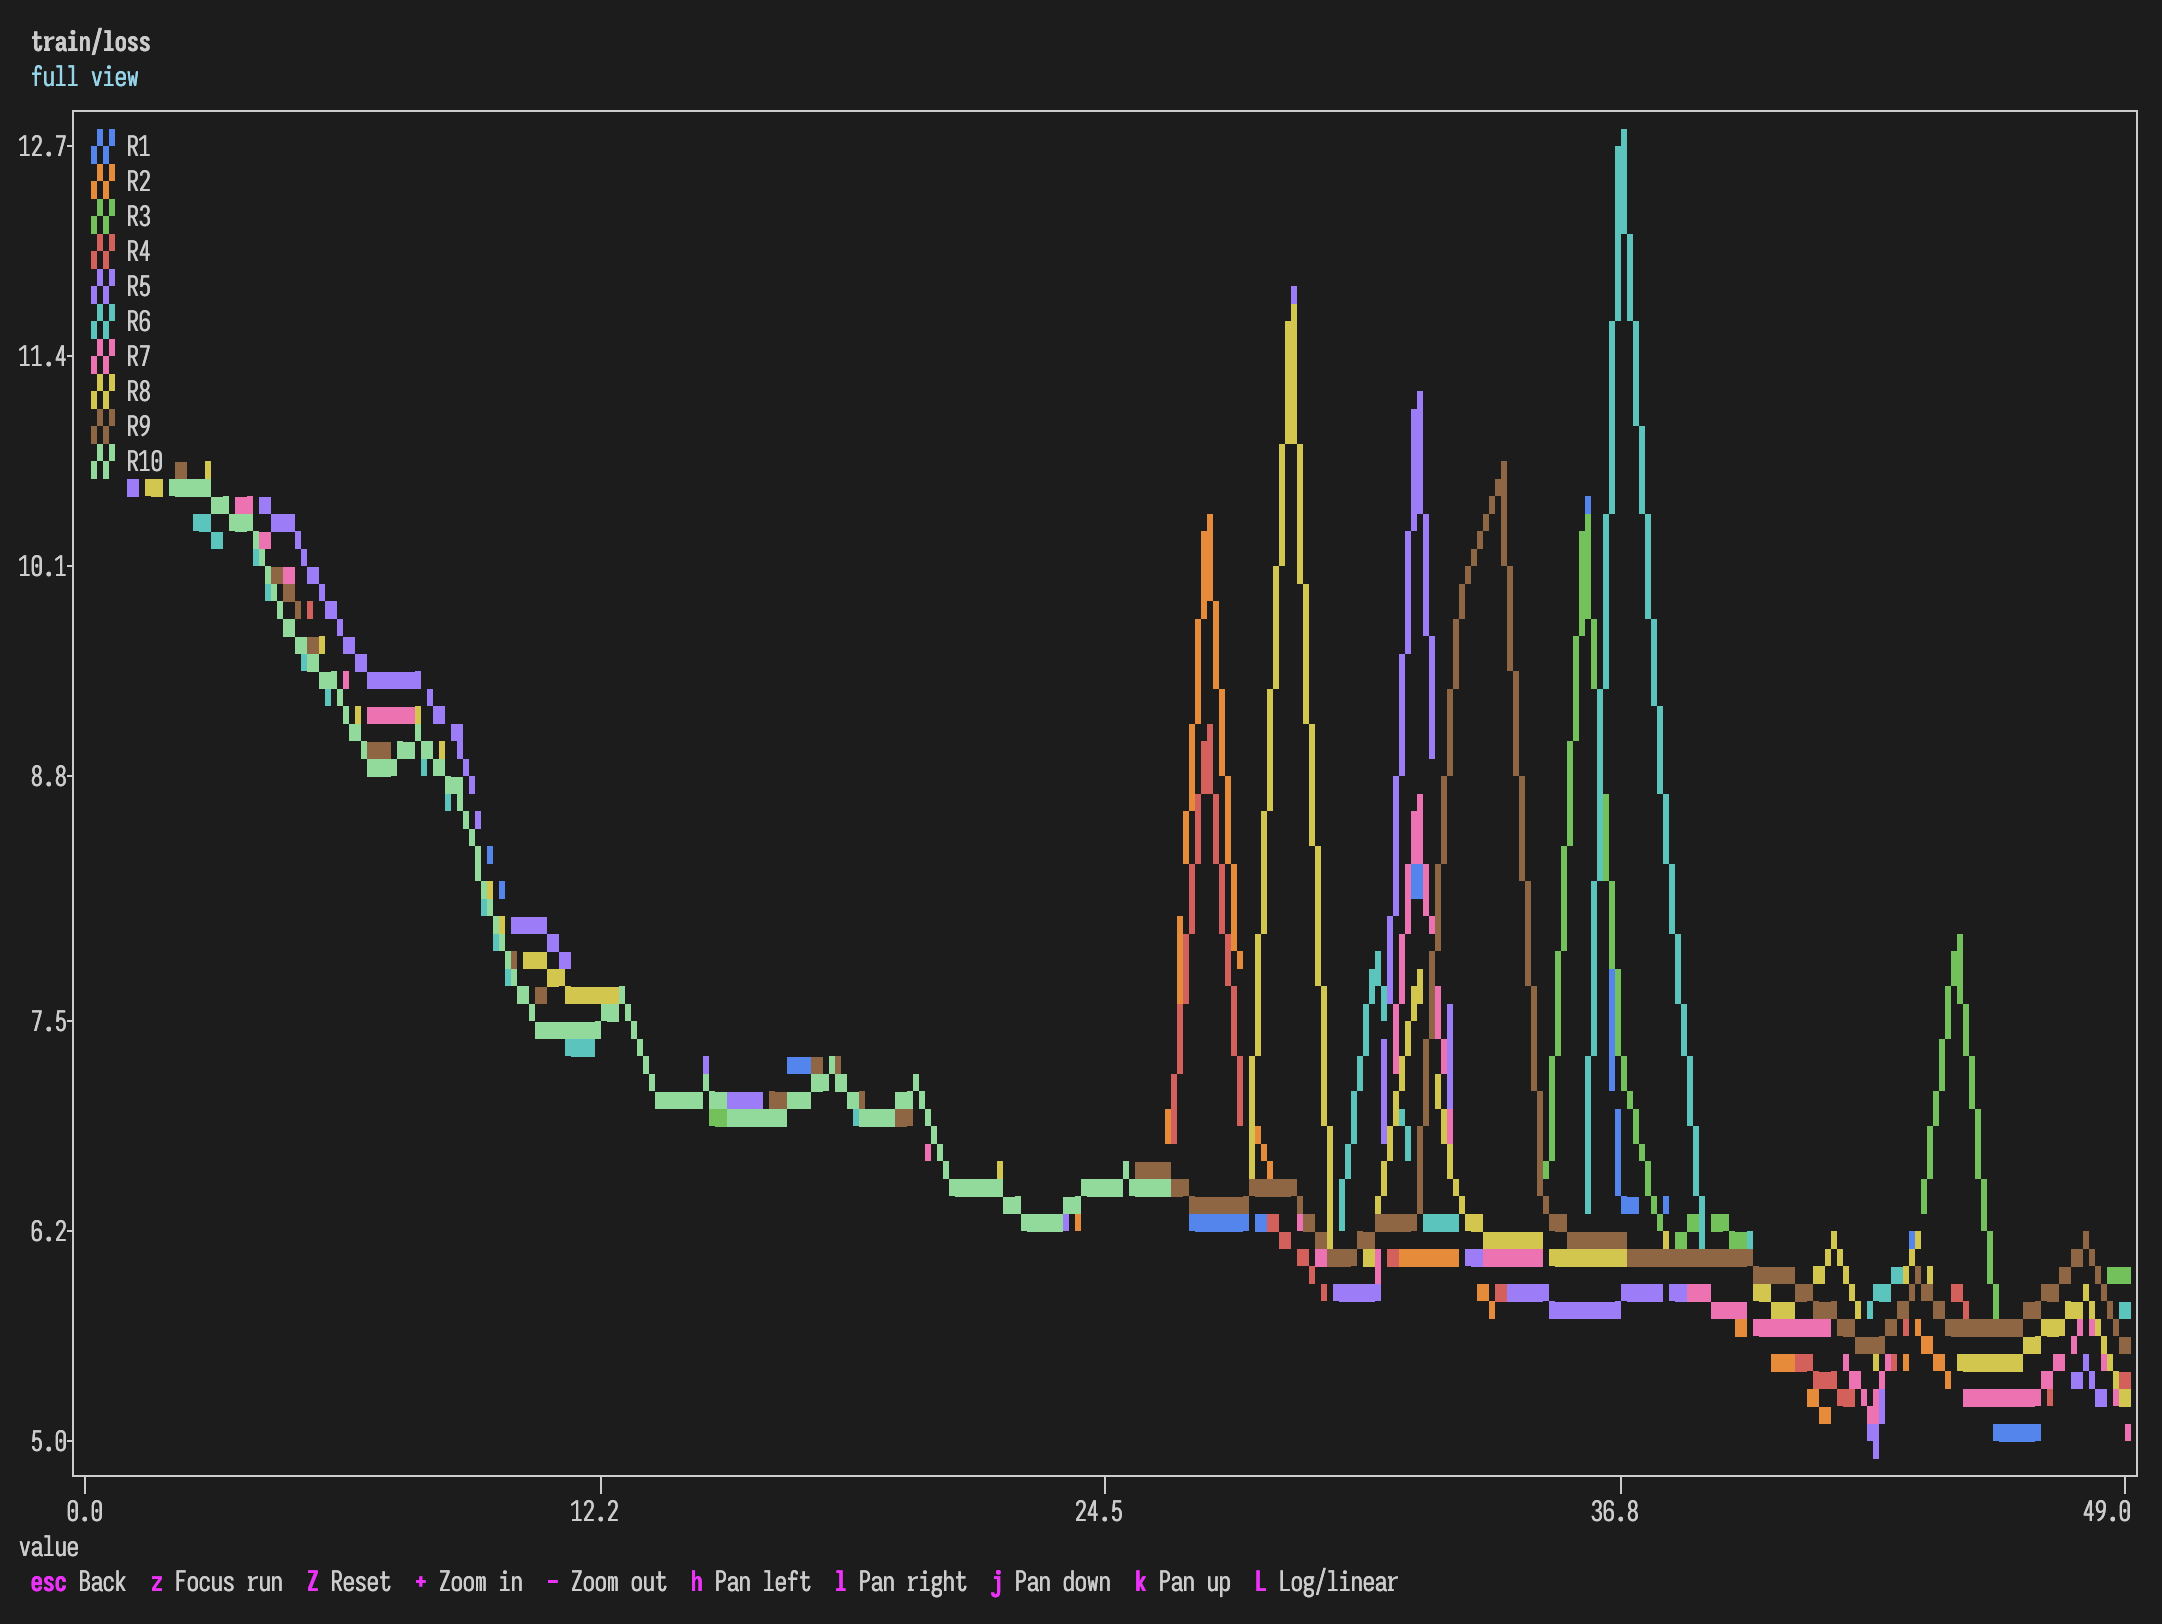
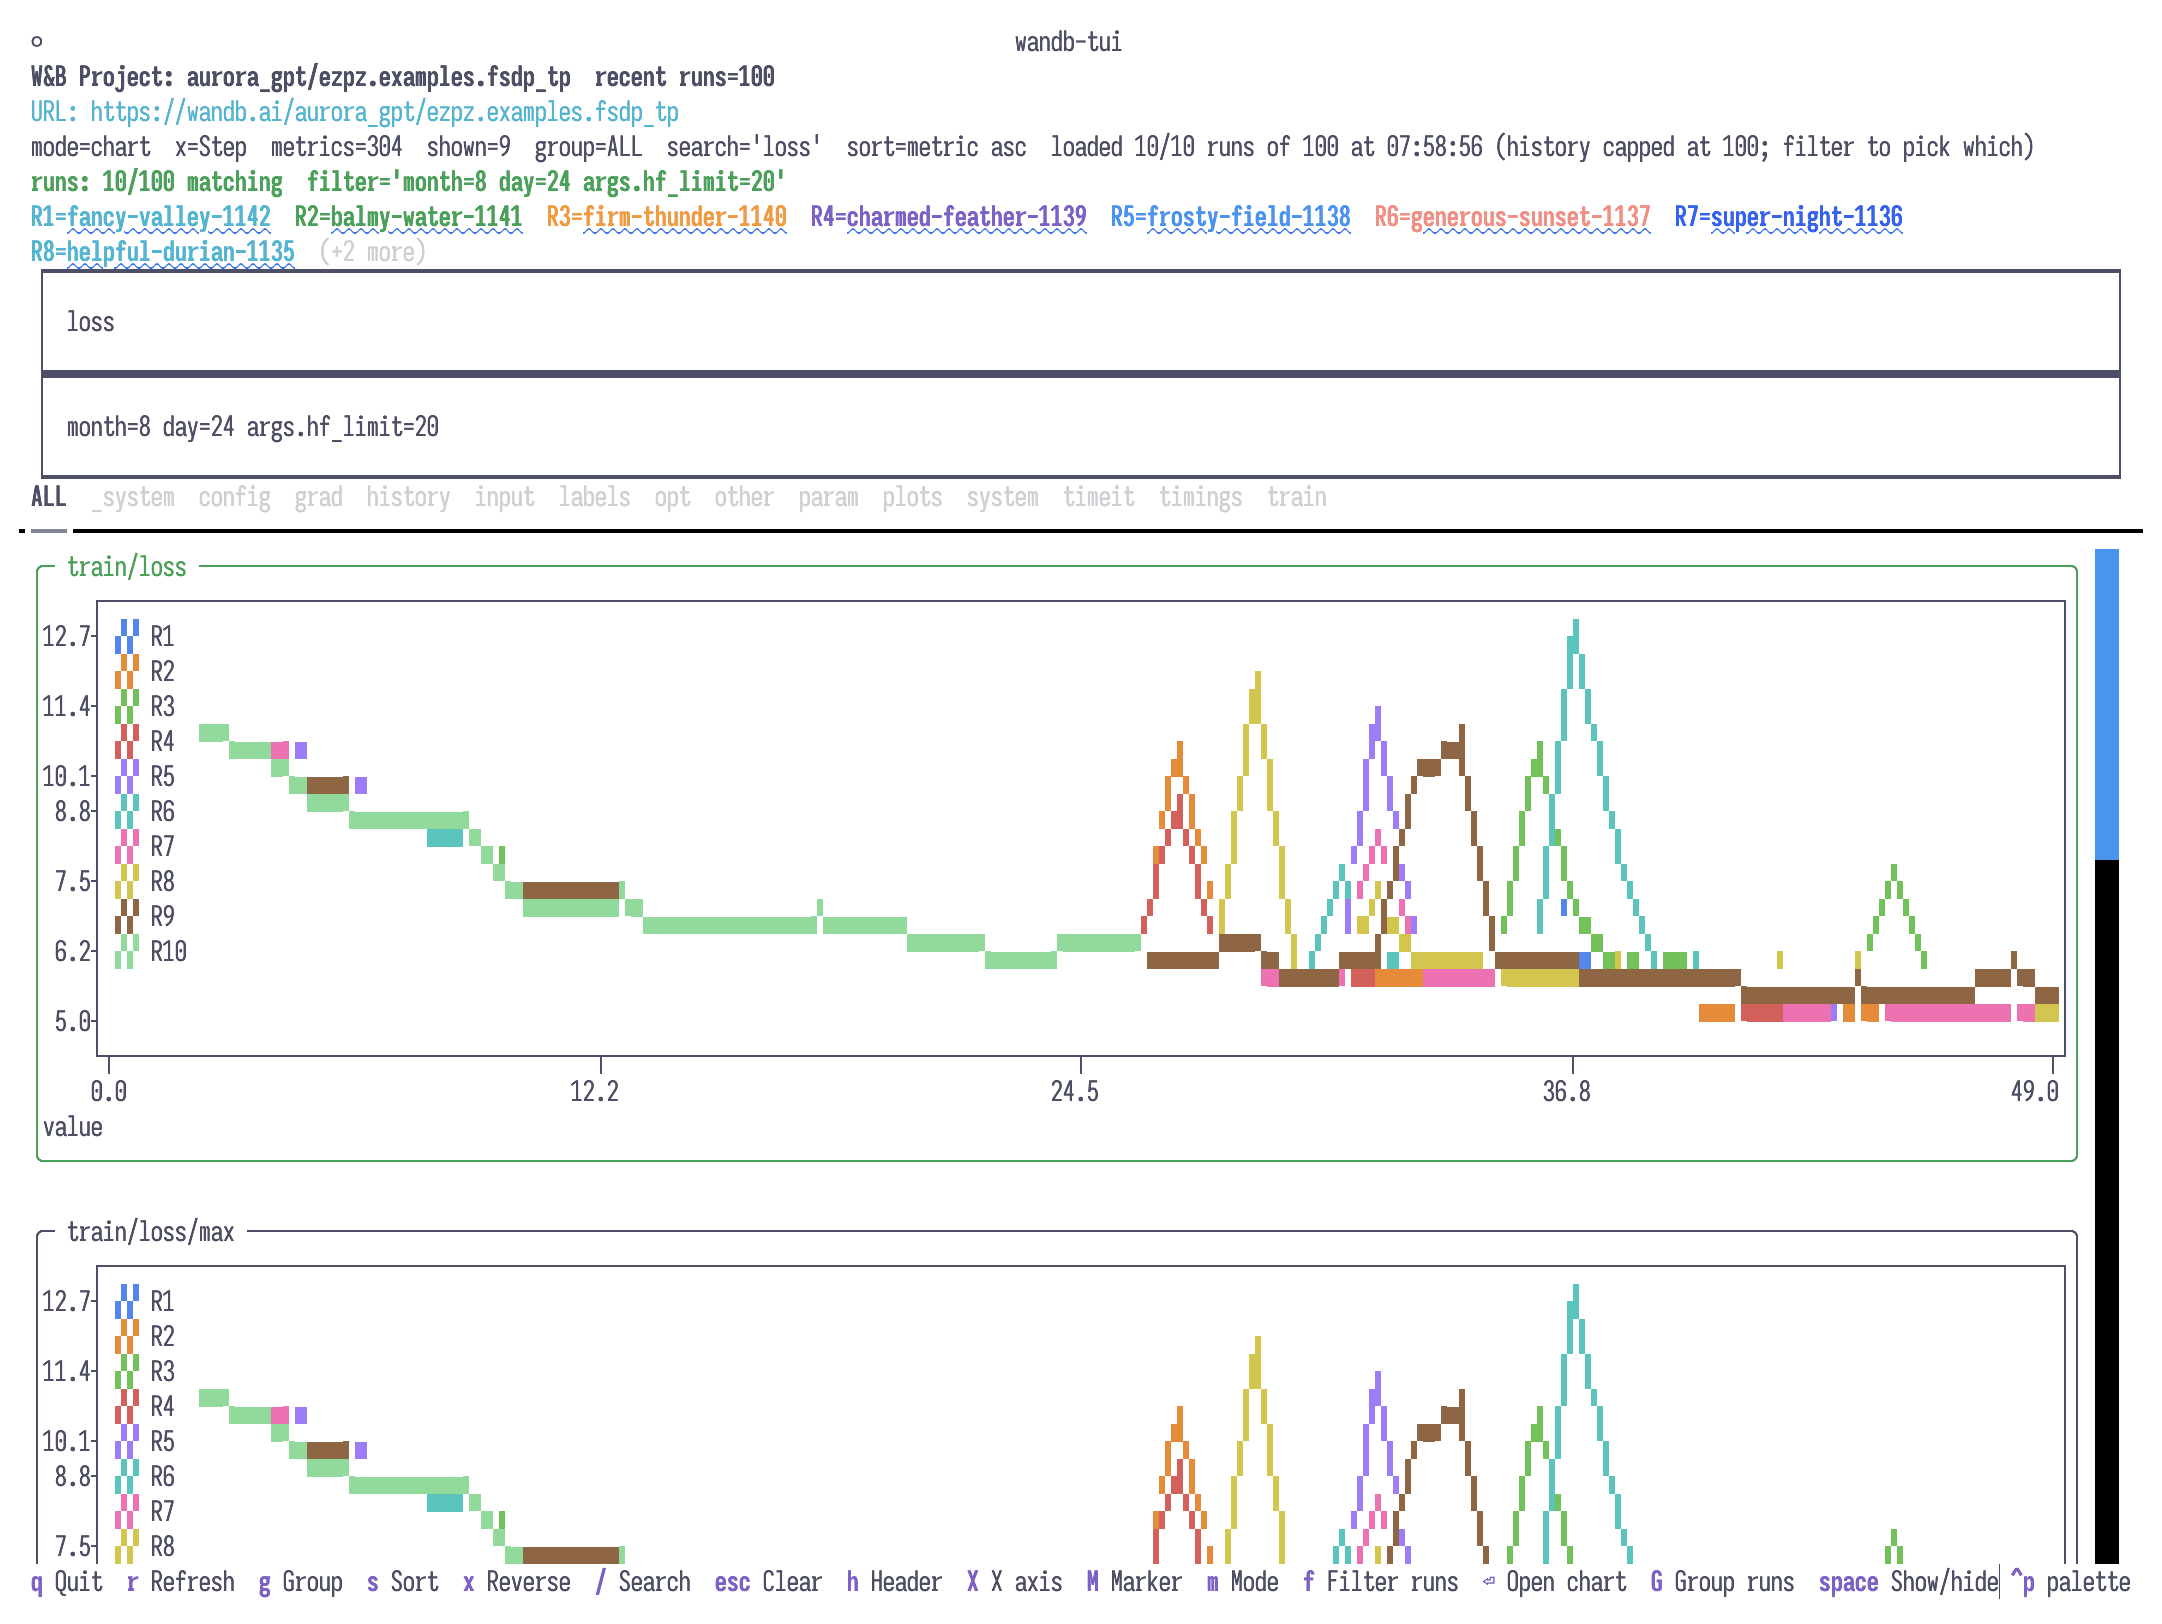
Ten runs from a 100-run project, filtered by config to one day’s work:
train/loss descending together from 11 to ~6, then fanning out into
divergent spikes — the shape you are actually looking for.
TL;DR — what it does and why it exists
A terminal dashboard for W&B runs, driven from a project or run URL. Works on
remote and cloud runs where the original local wandb/ directories are
not on the machine you are sitting at — see
why the URL matters.
Compares many runs in a table or as overlaid charts, groups them into a tree by any config keys, and follows your terminal’s light/dark theme.
uvx wandb-tui with no arguments opens an interactive entity/project picker.
Why a URL, and not a run directory
Most terminal tooling for experiment tracking reads the local wandb/
directory that a run wrote as it trained. That works when you trained on the
machine you are sitting at.
It does not work for the case this was built for: a job that ran on a compute node, or in the cloud, whose artifacts live in W&B’s backend and whose local directory is either on a filesystem you are not currently on, or gone entirely. What you have is a URL.
So the URL is the input. wandb-tui fetches from the API, works against public
runs without wandb installed at all, and picks up WANDB_API_KEY
automatically for private ones.
Reading many runs at once
The core case is comparison: ten runs from a hundred-run project, filtered down to one day’s work, and you want to see which ones diverged.
- Table mode puts every metric side by side across runs, narrowed by a config filter and a metric search, with W&B-style per-run colored columns so a run keeps its identity between views.
- Chart mode (
m) overlays the same metrics as plotext line charts, tiling every match and scrolling rather than capping how many you can see. Enteropens the chart under the cursor full-screen with zoom, pan, per-run focus, axis limits, and a log/linear toggle.
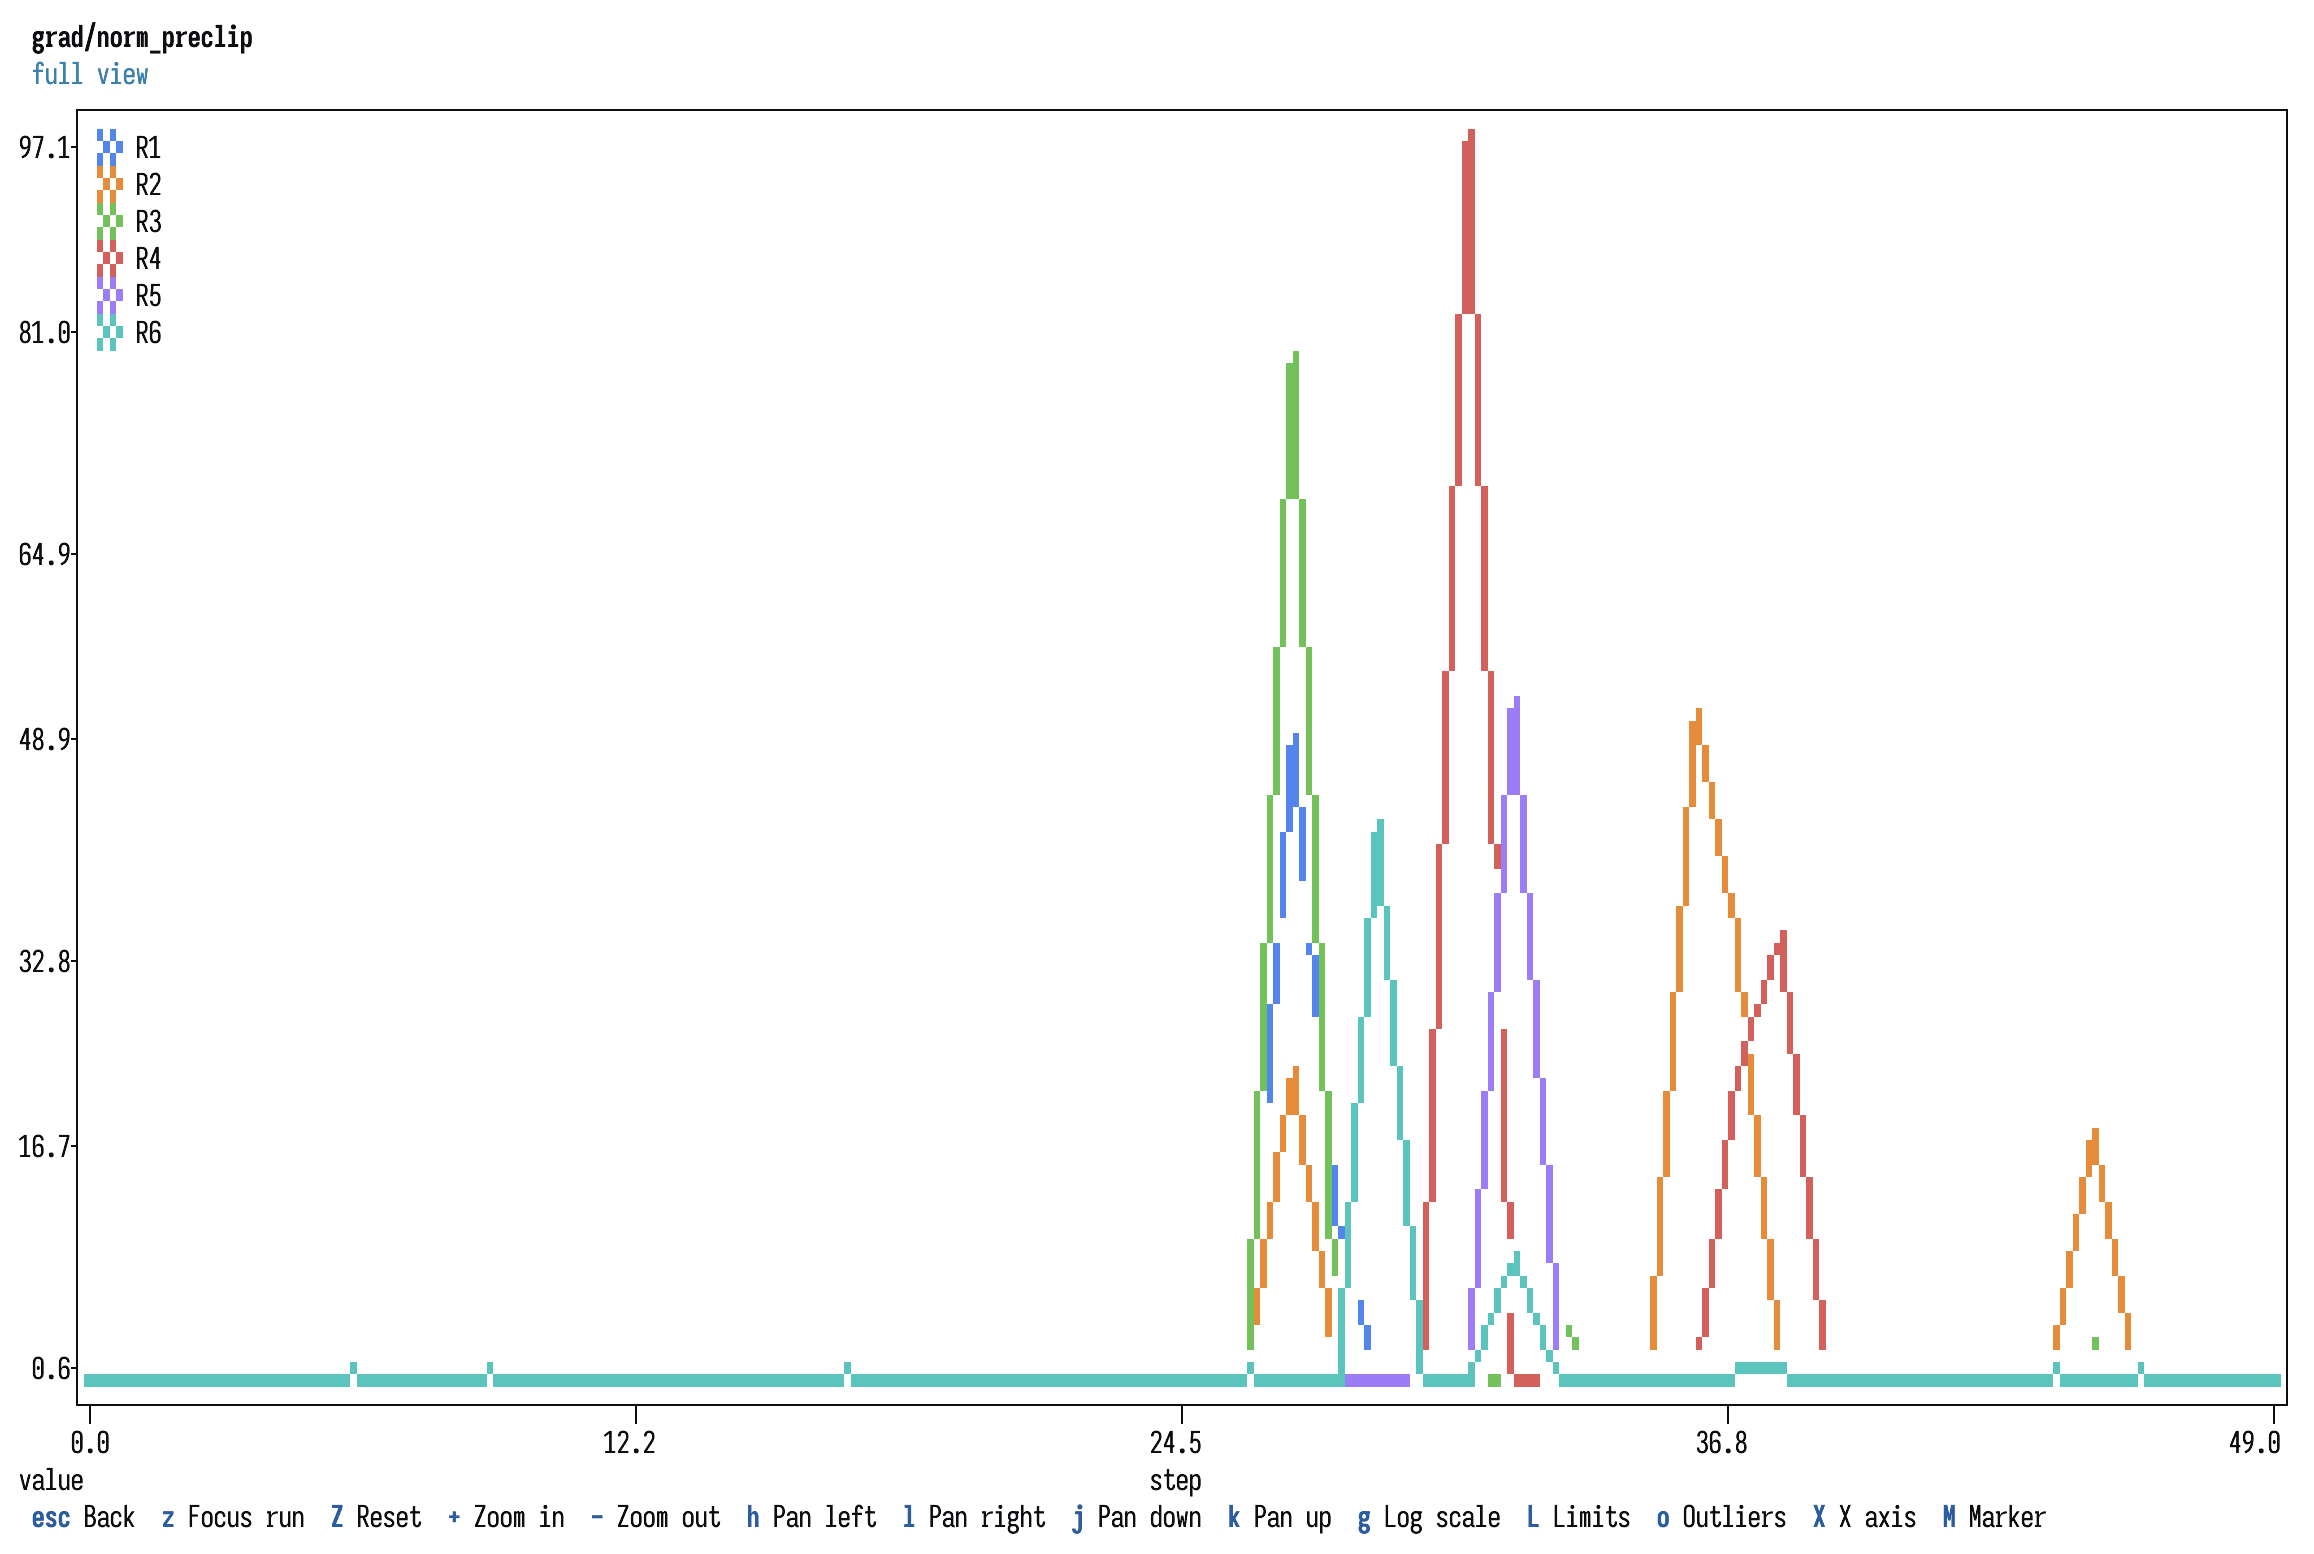
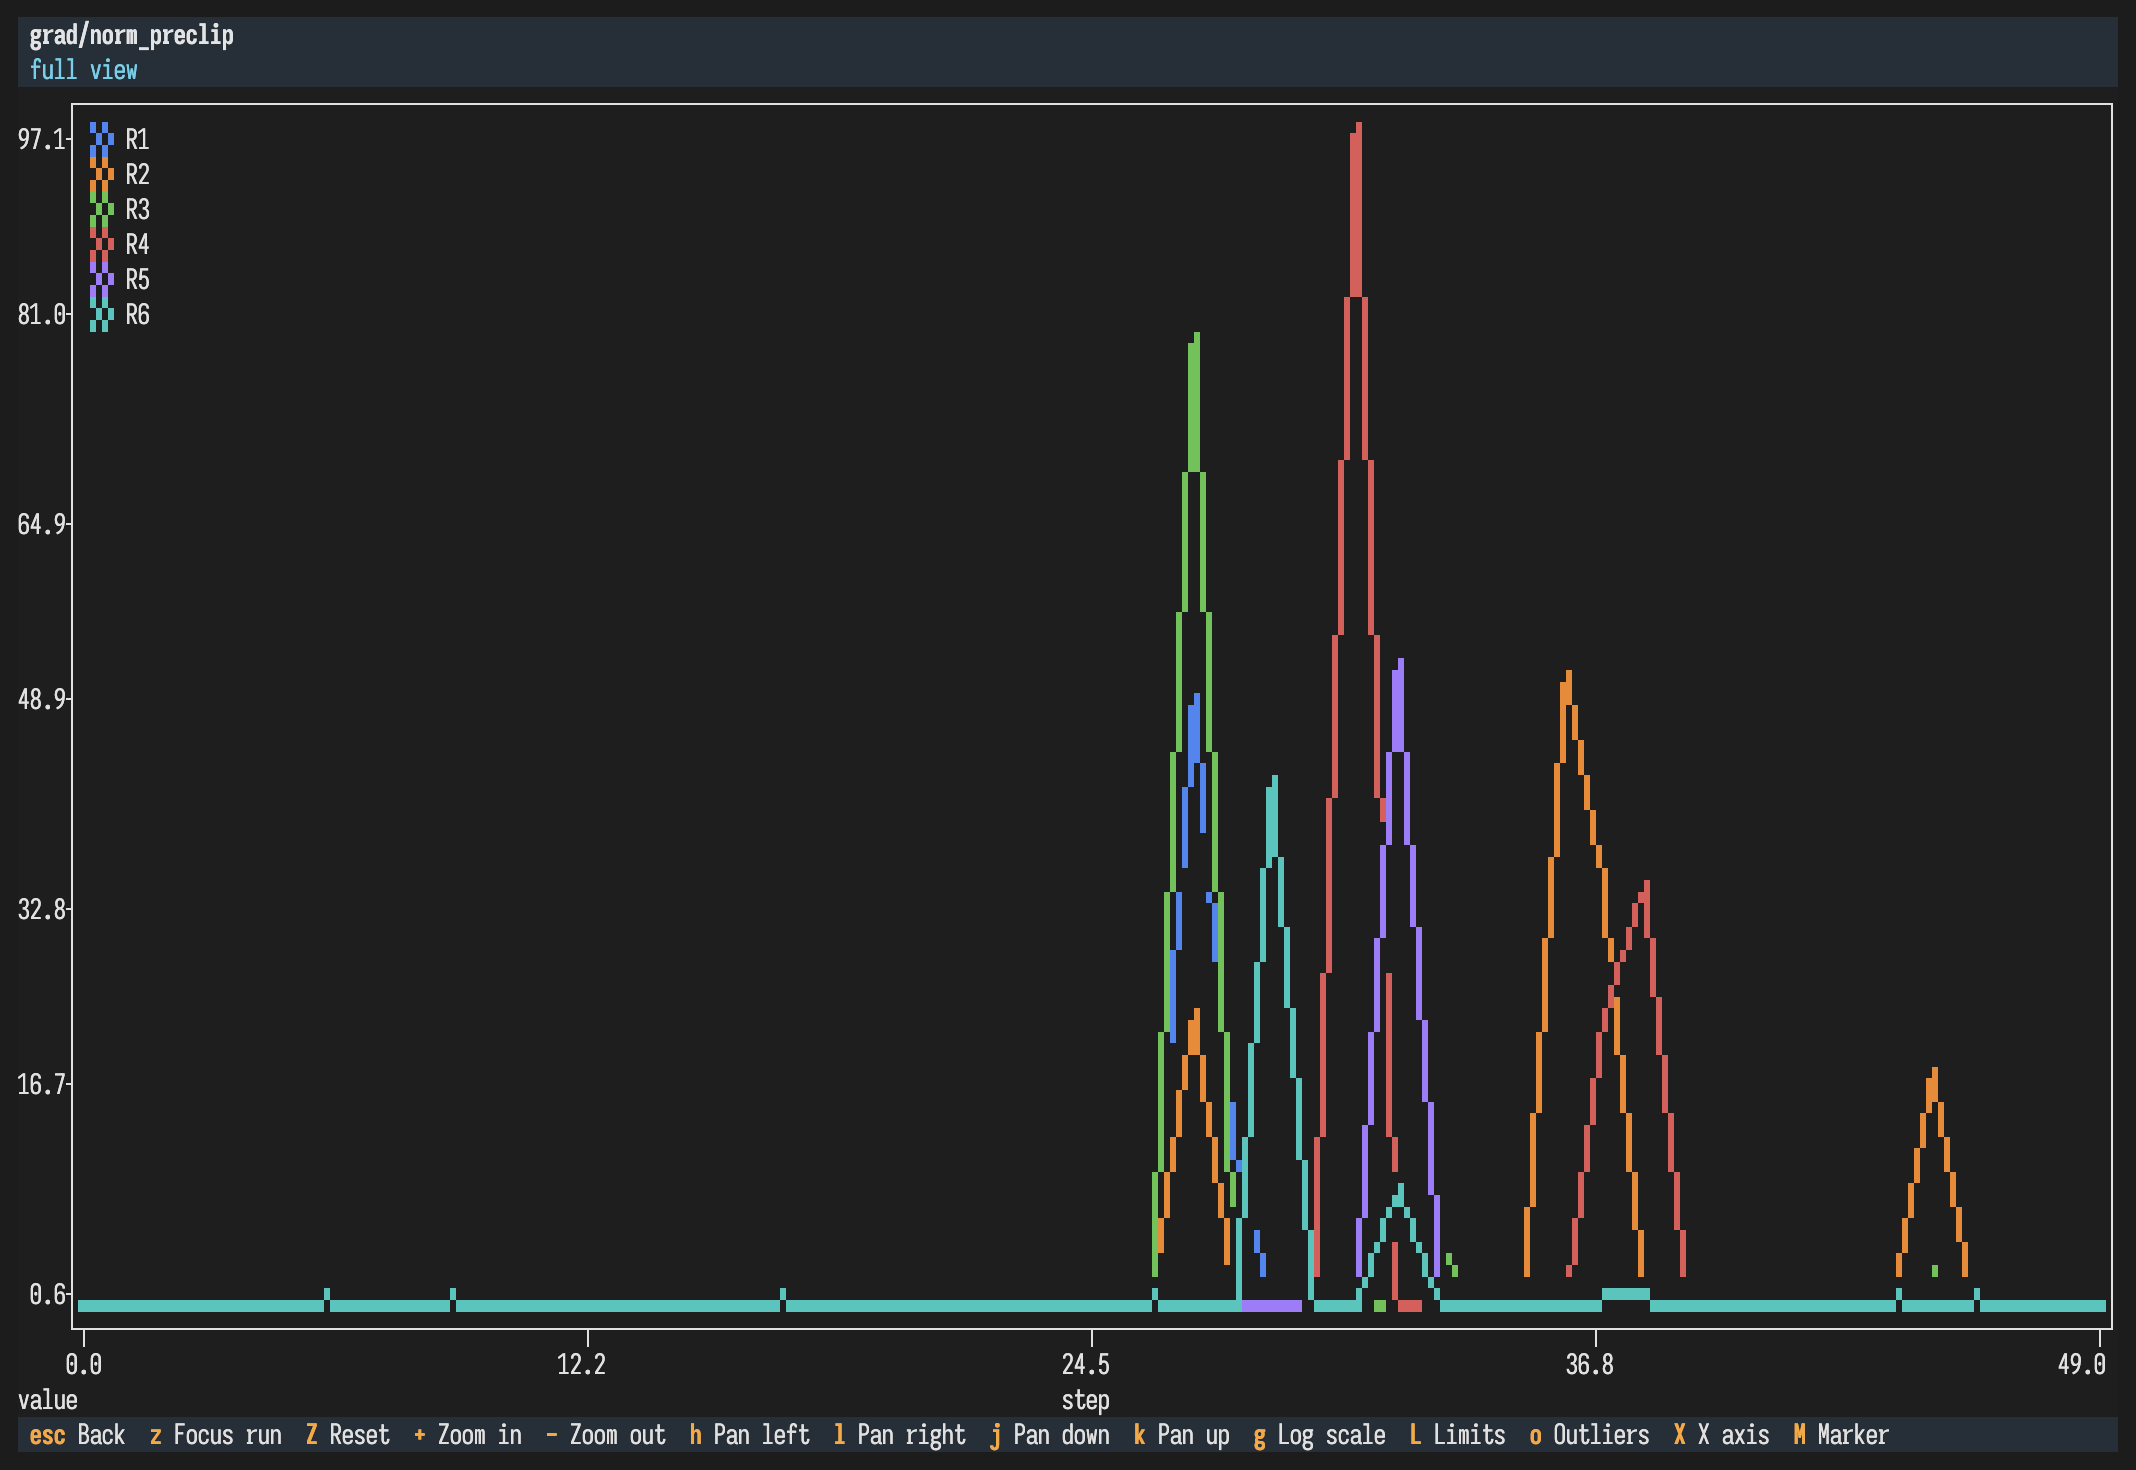
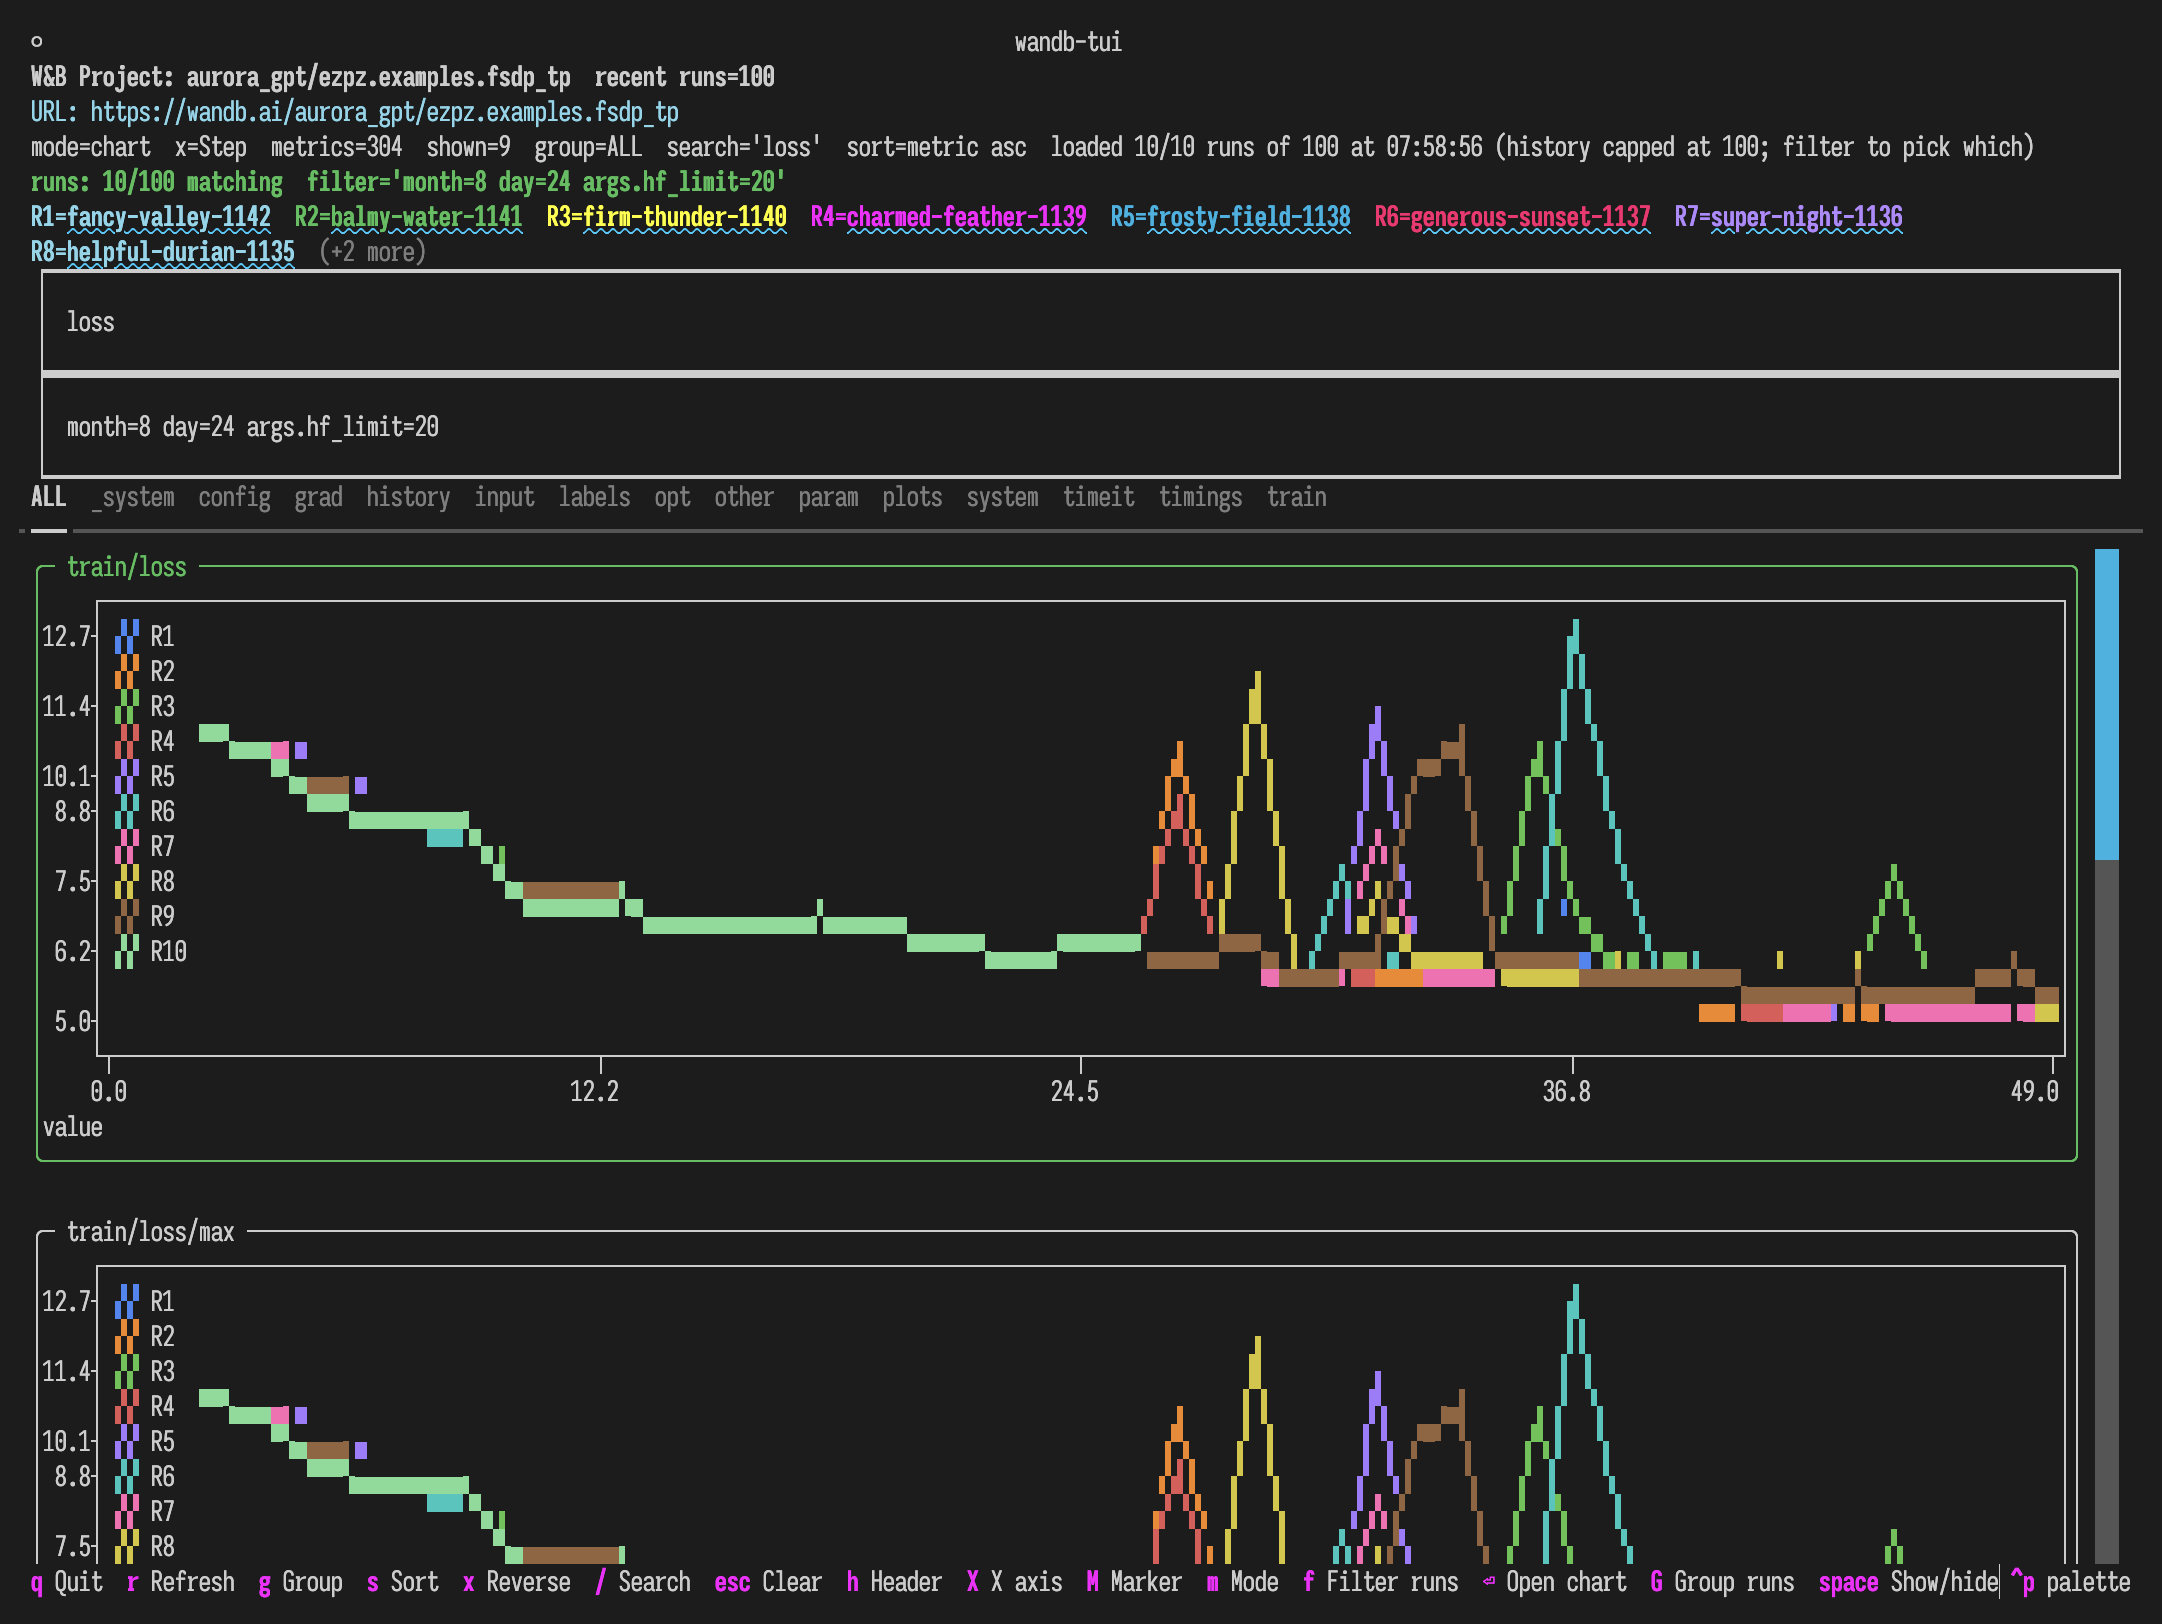
Chart mode tiles every matching metric and scrolls, rather than capping how many fit:
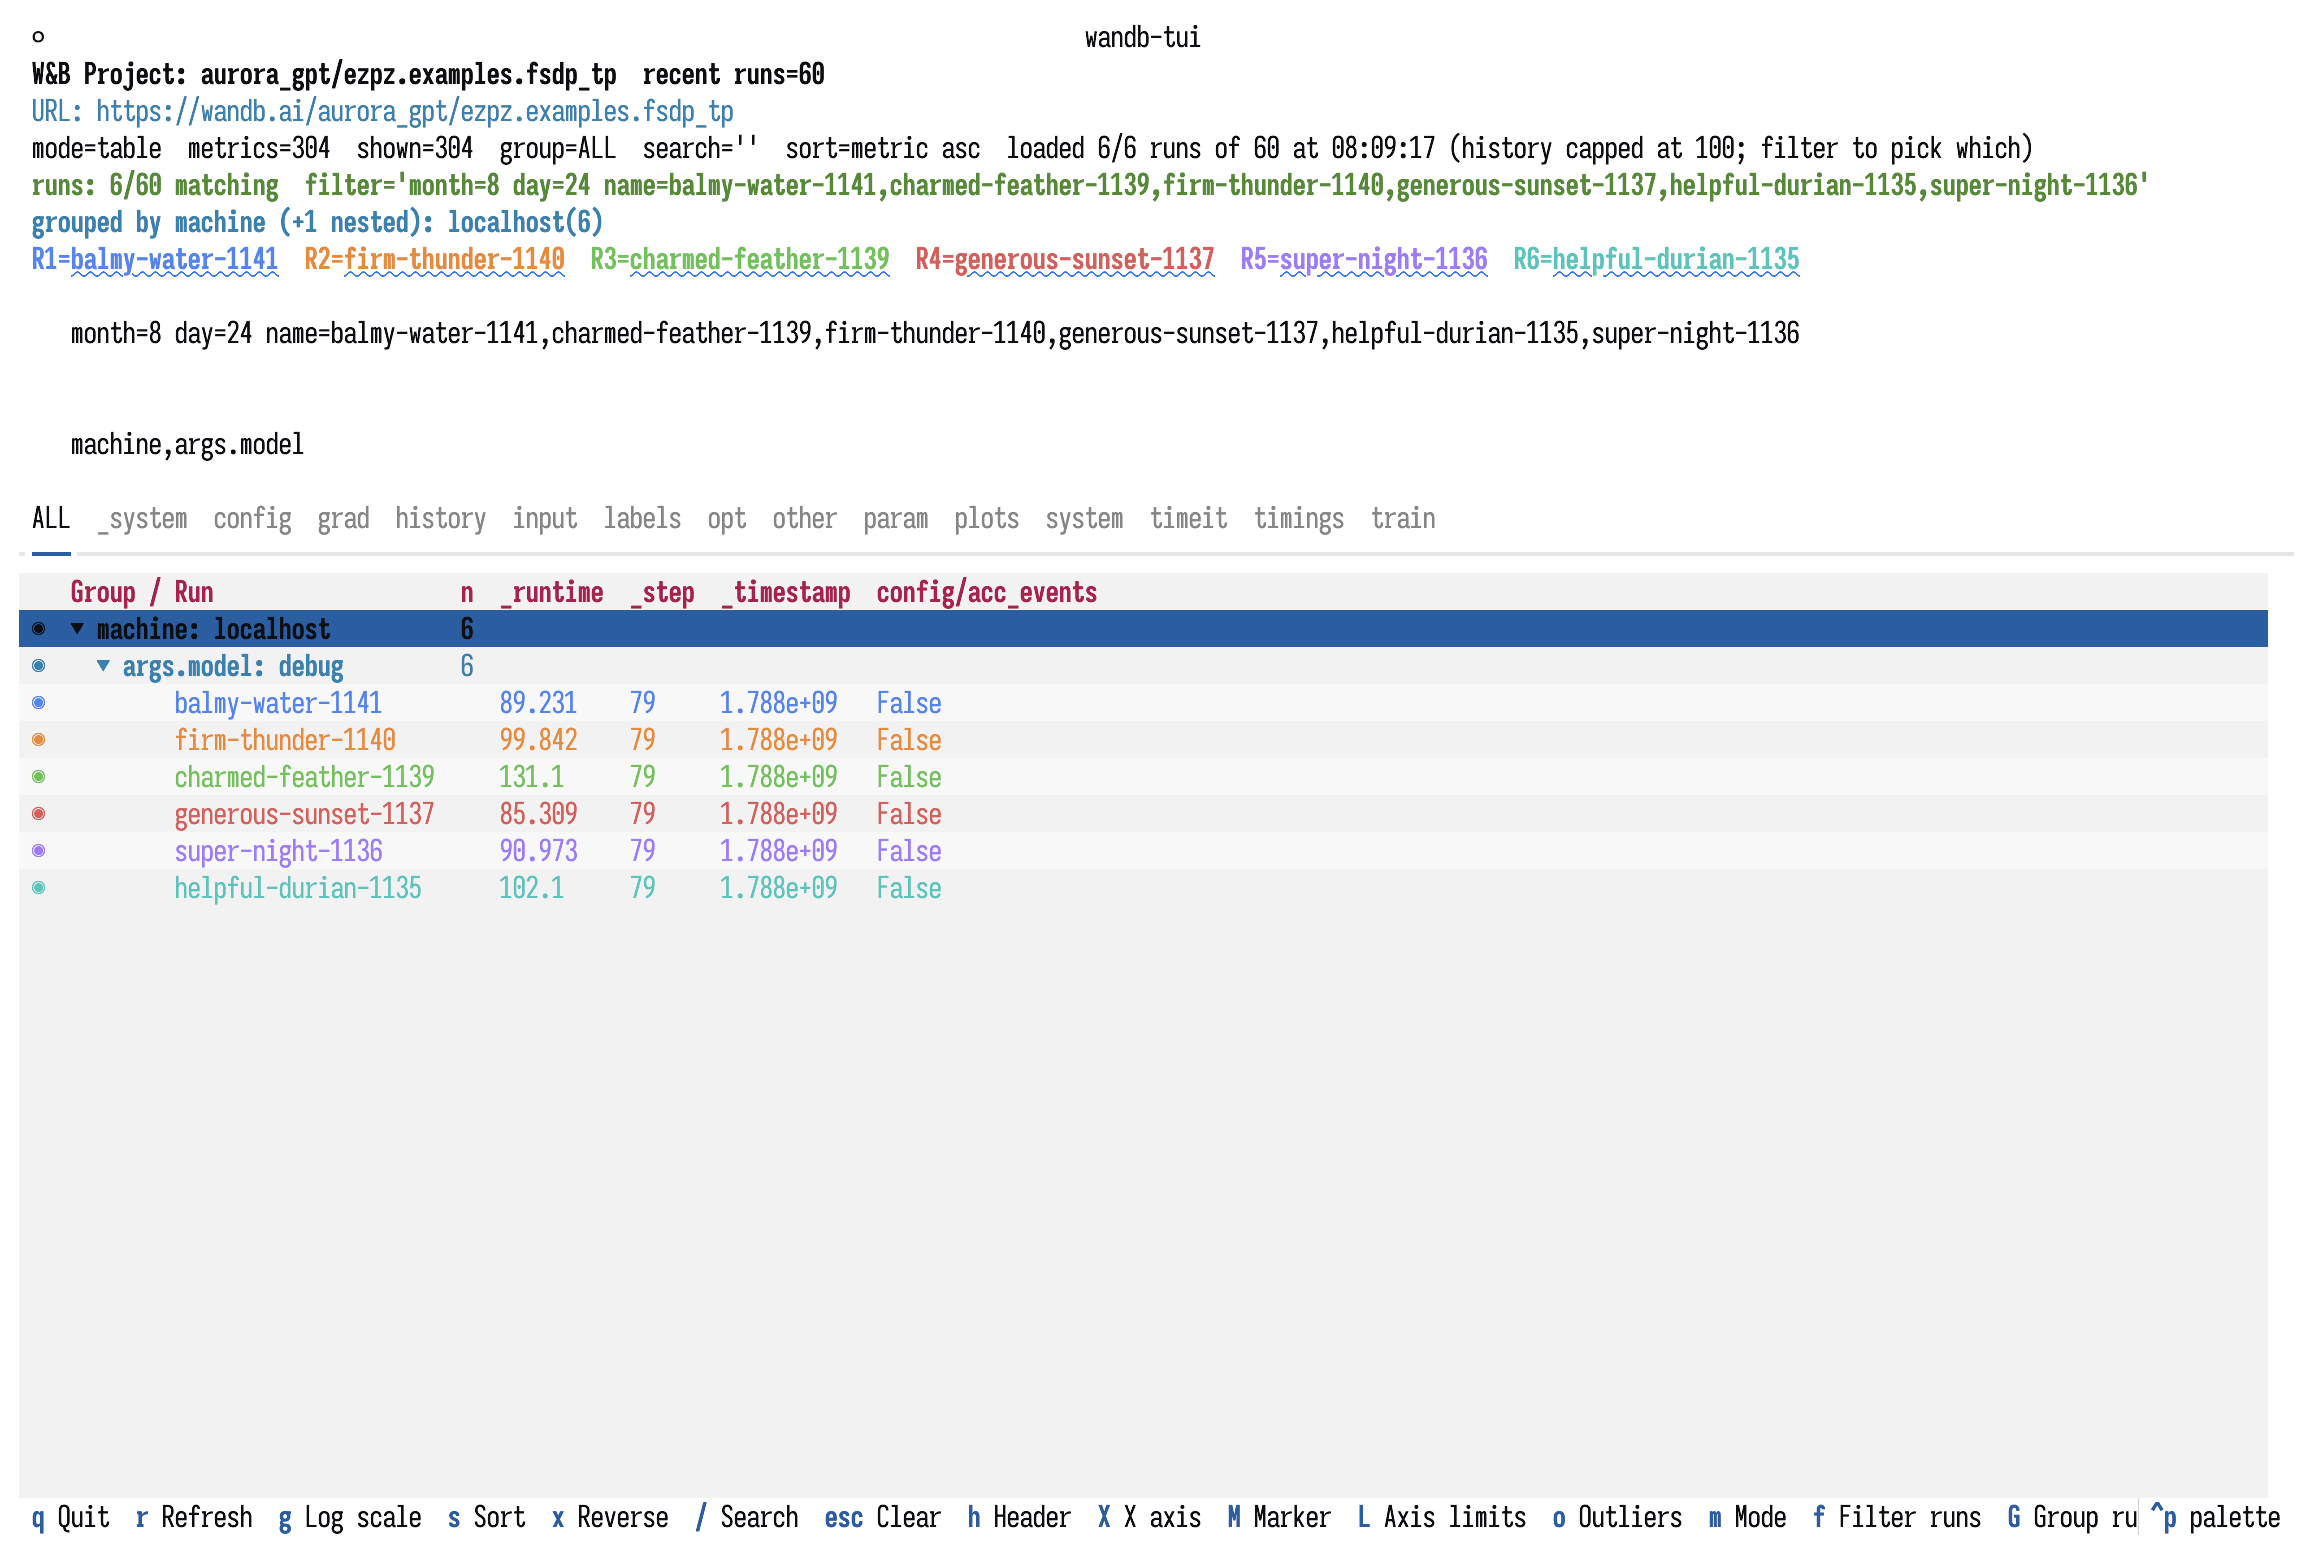
- The group tree collapses runs by any config keys —
world_sizeand model flavor, say — with per-run metrics alongside and a visibility gutter that toggles individual runs in and out of the charts.
A single run gets its own view: min/mean/max per metric with inline sparklines.
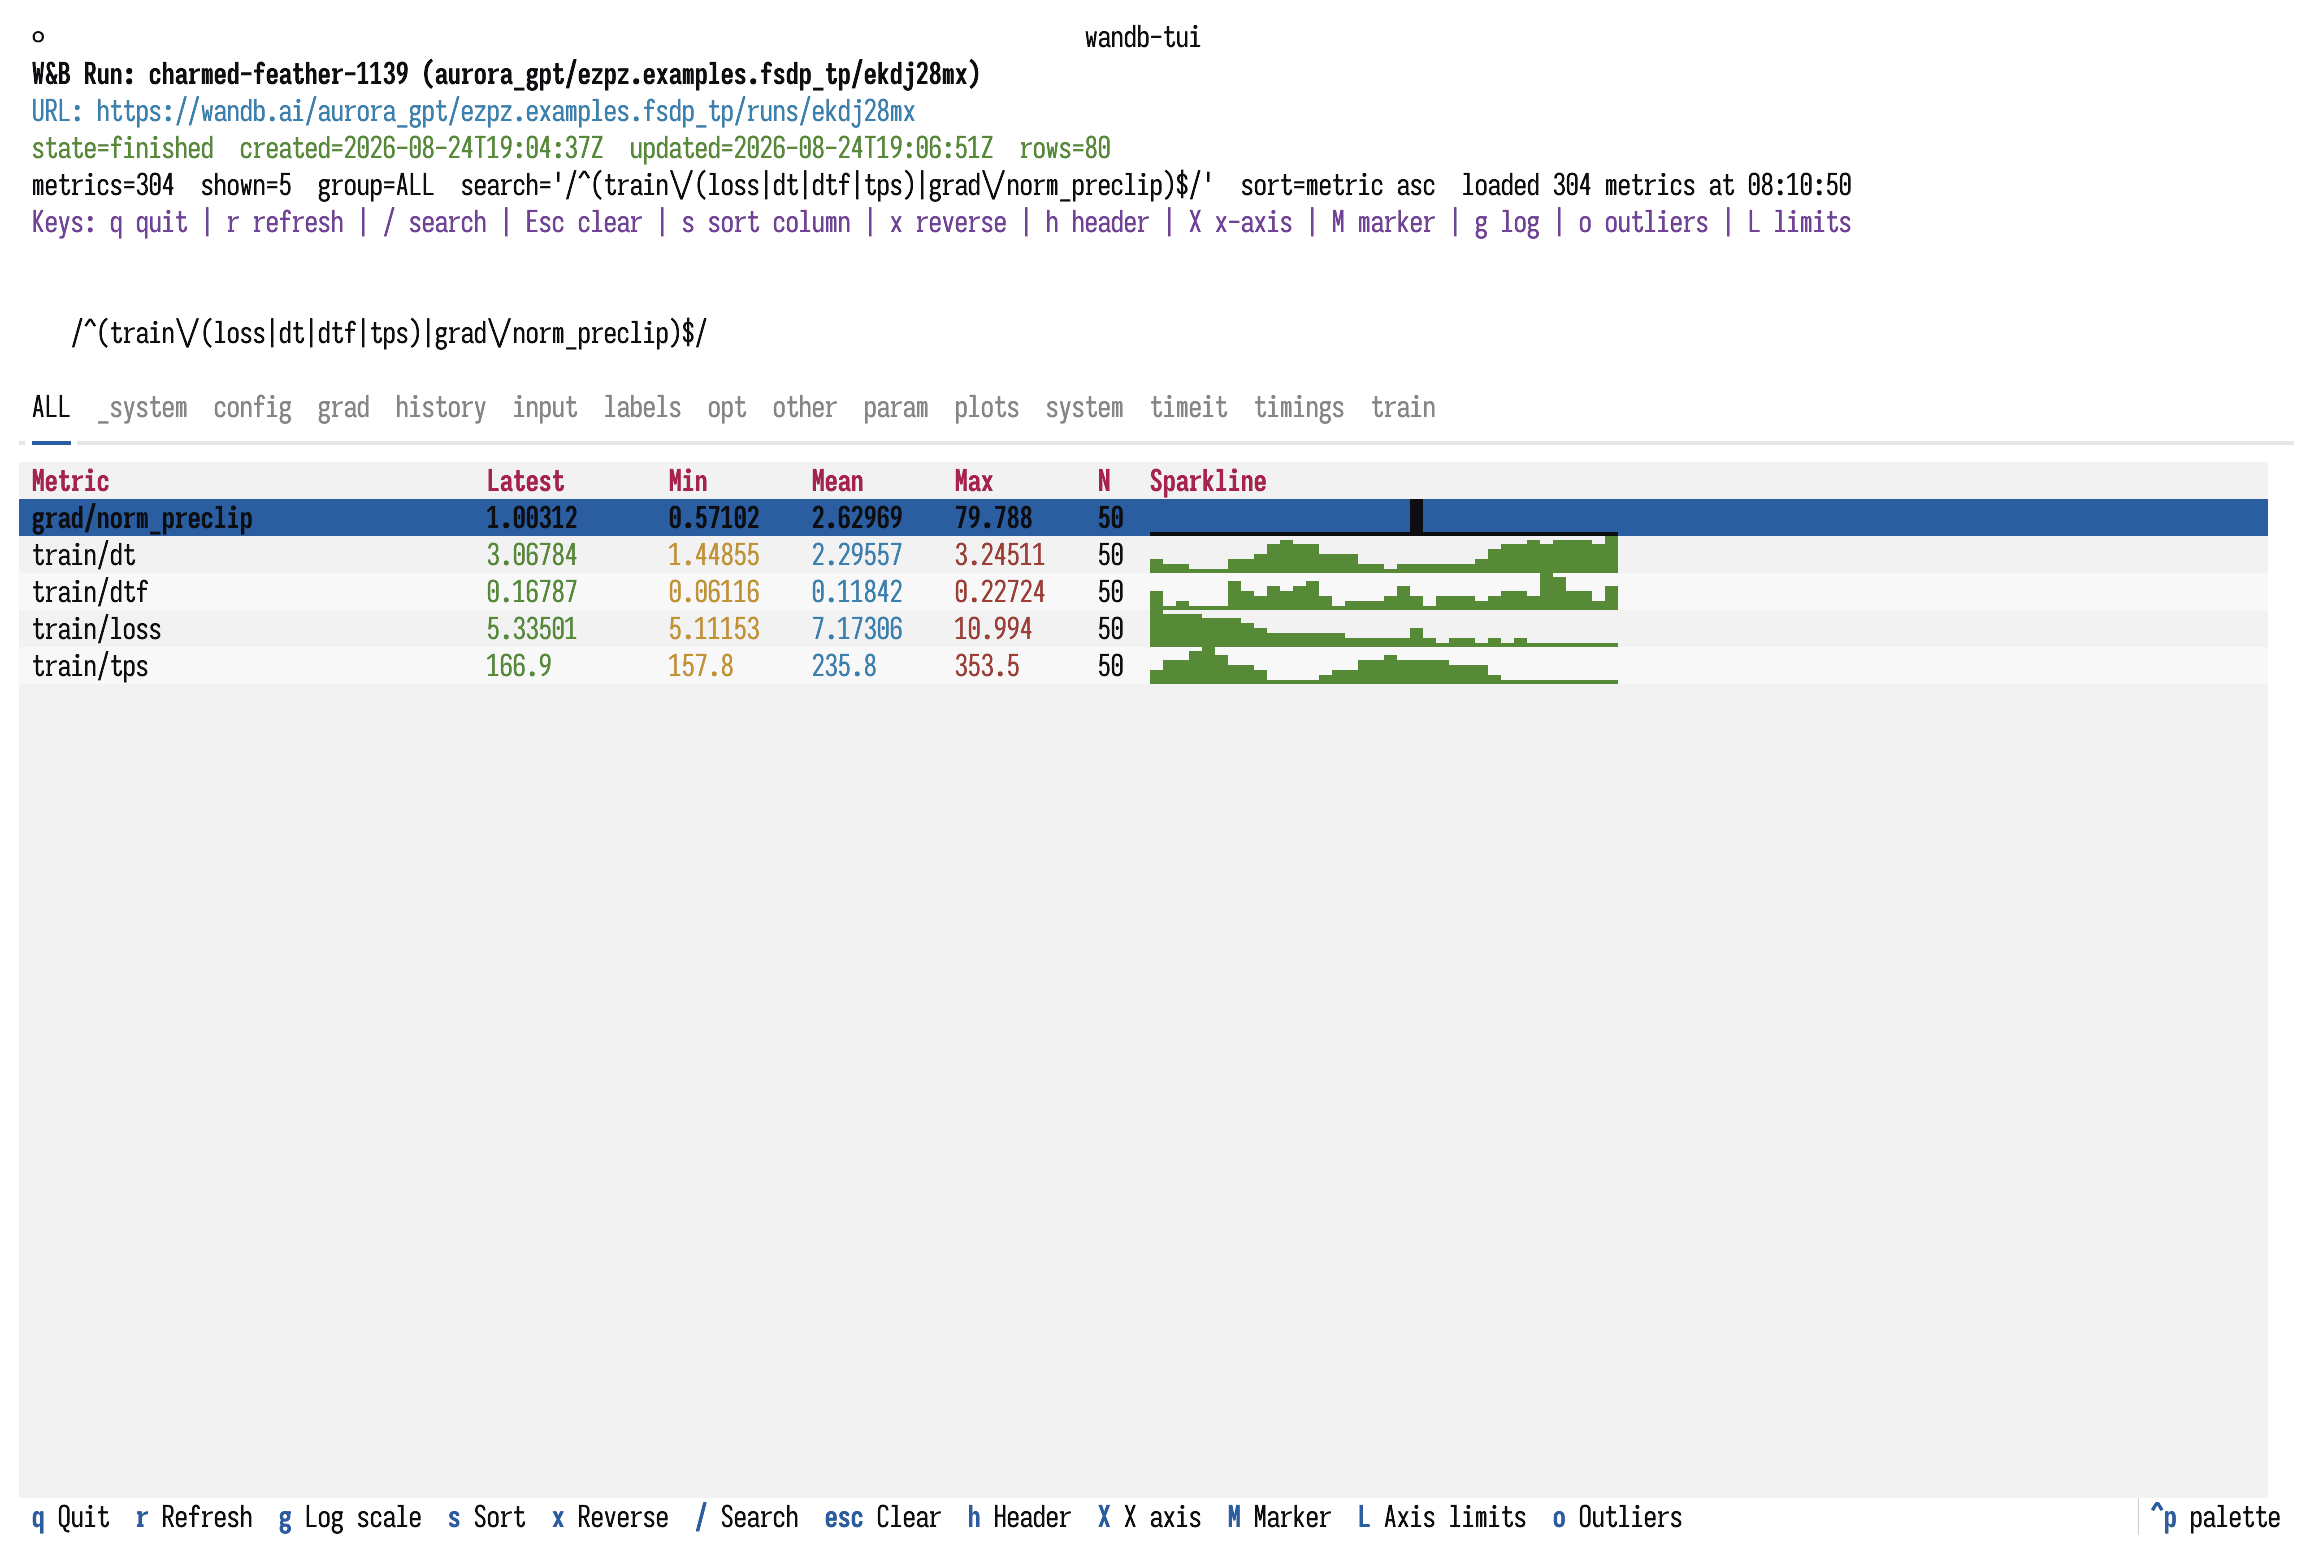
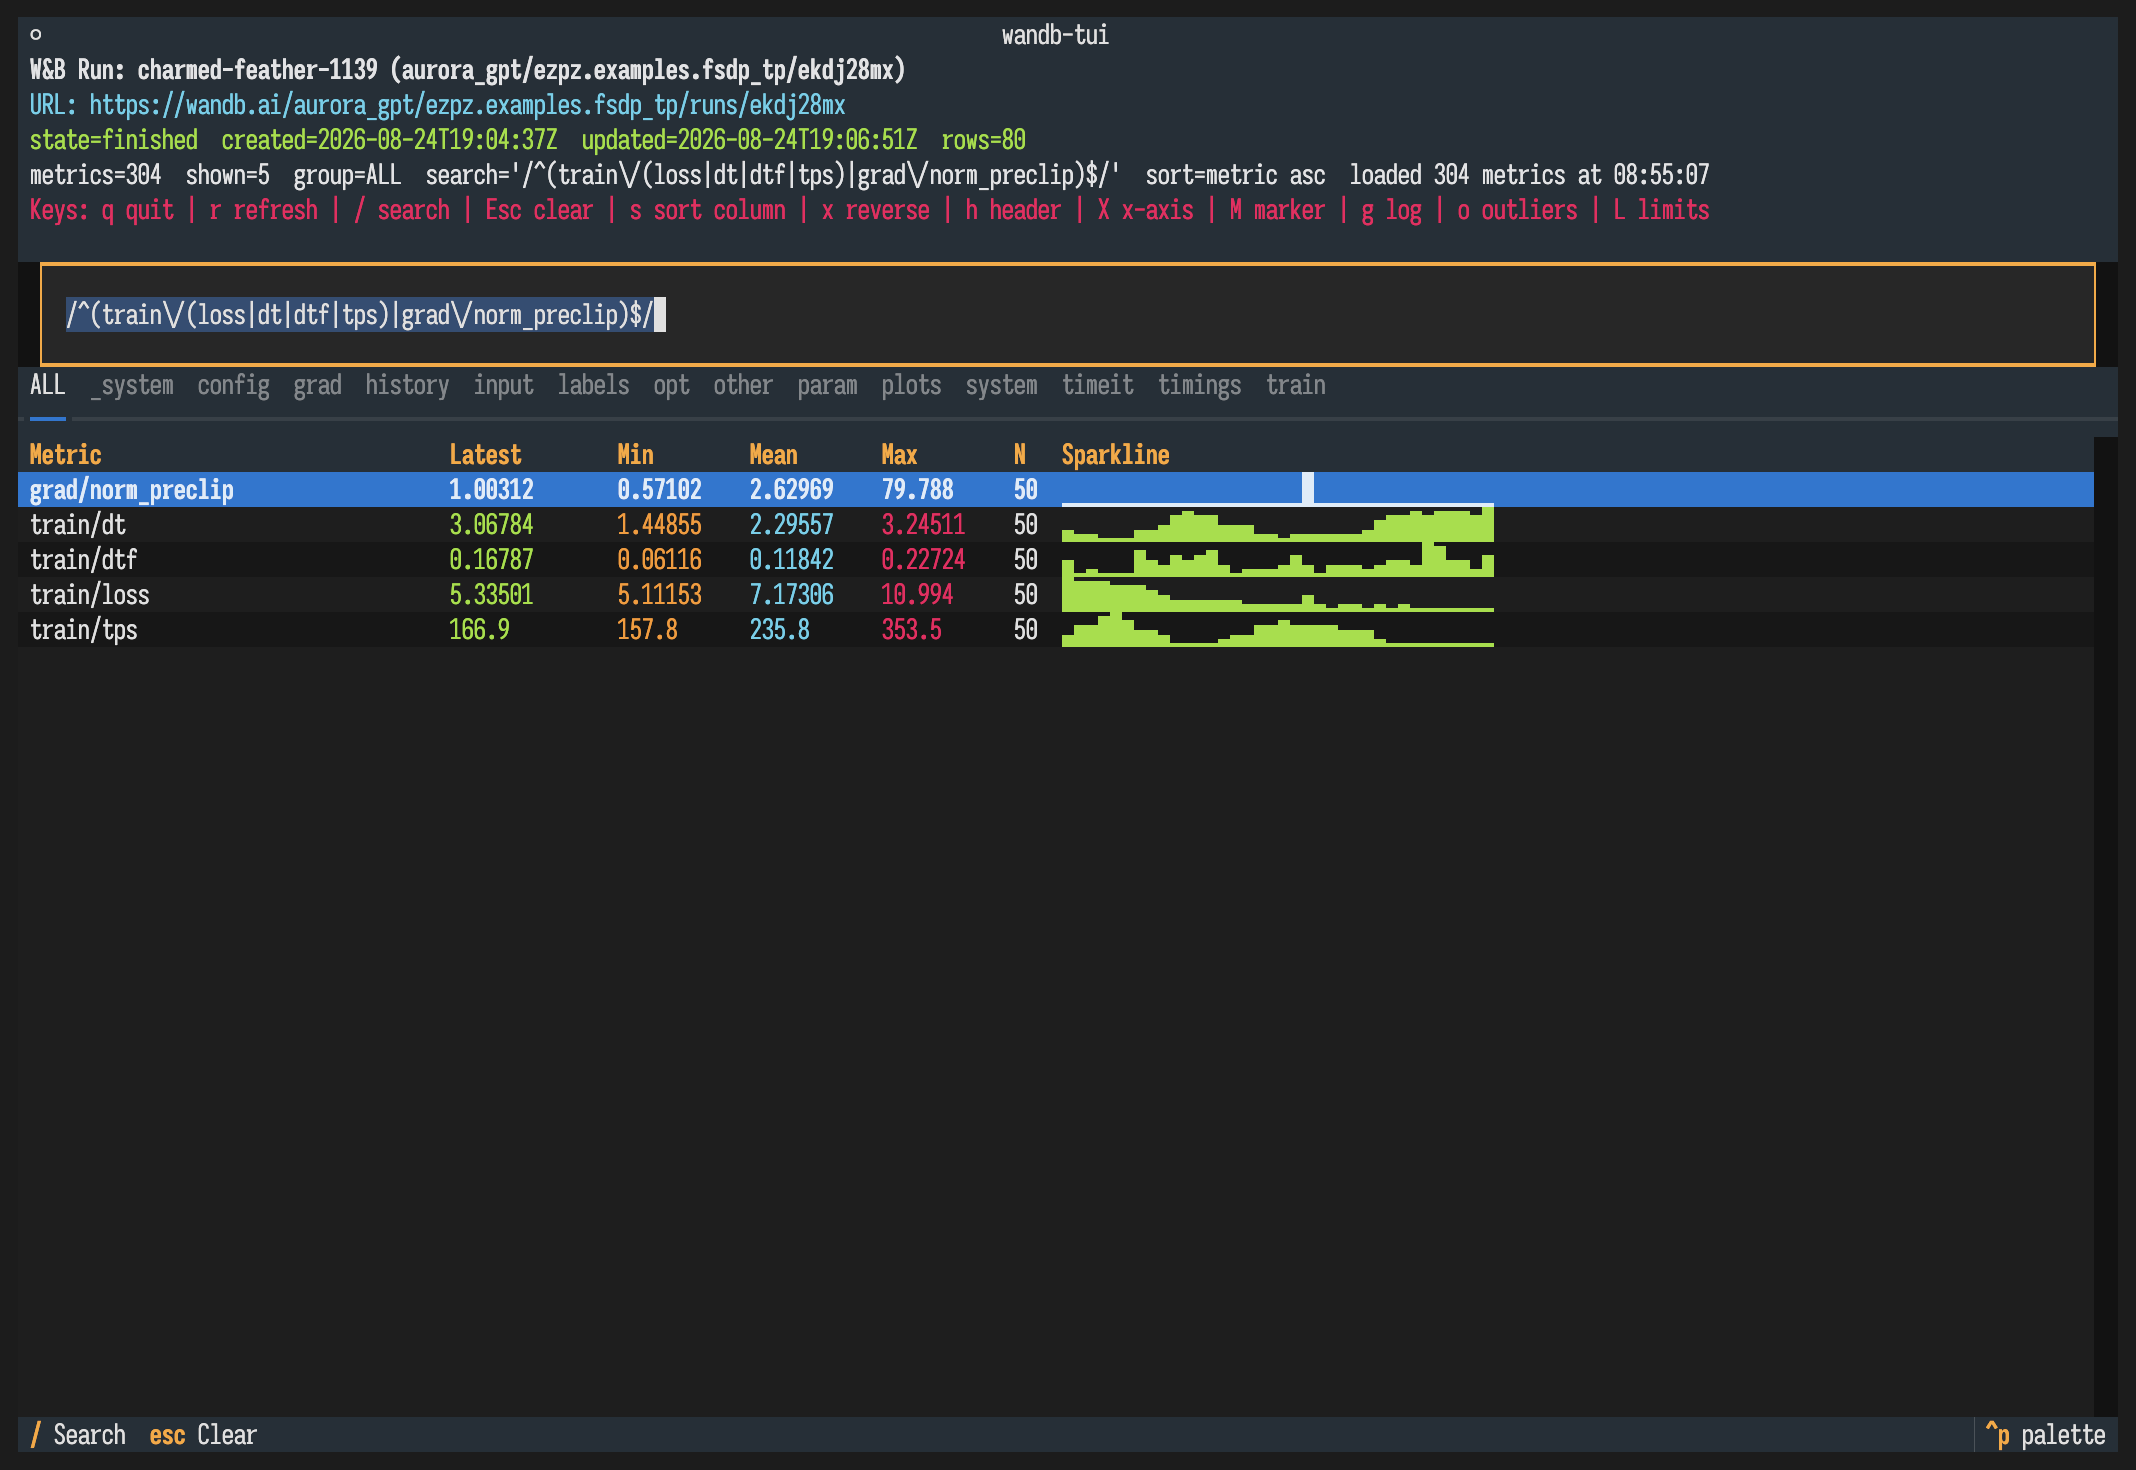
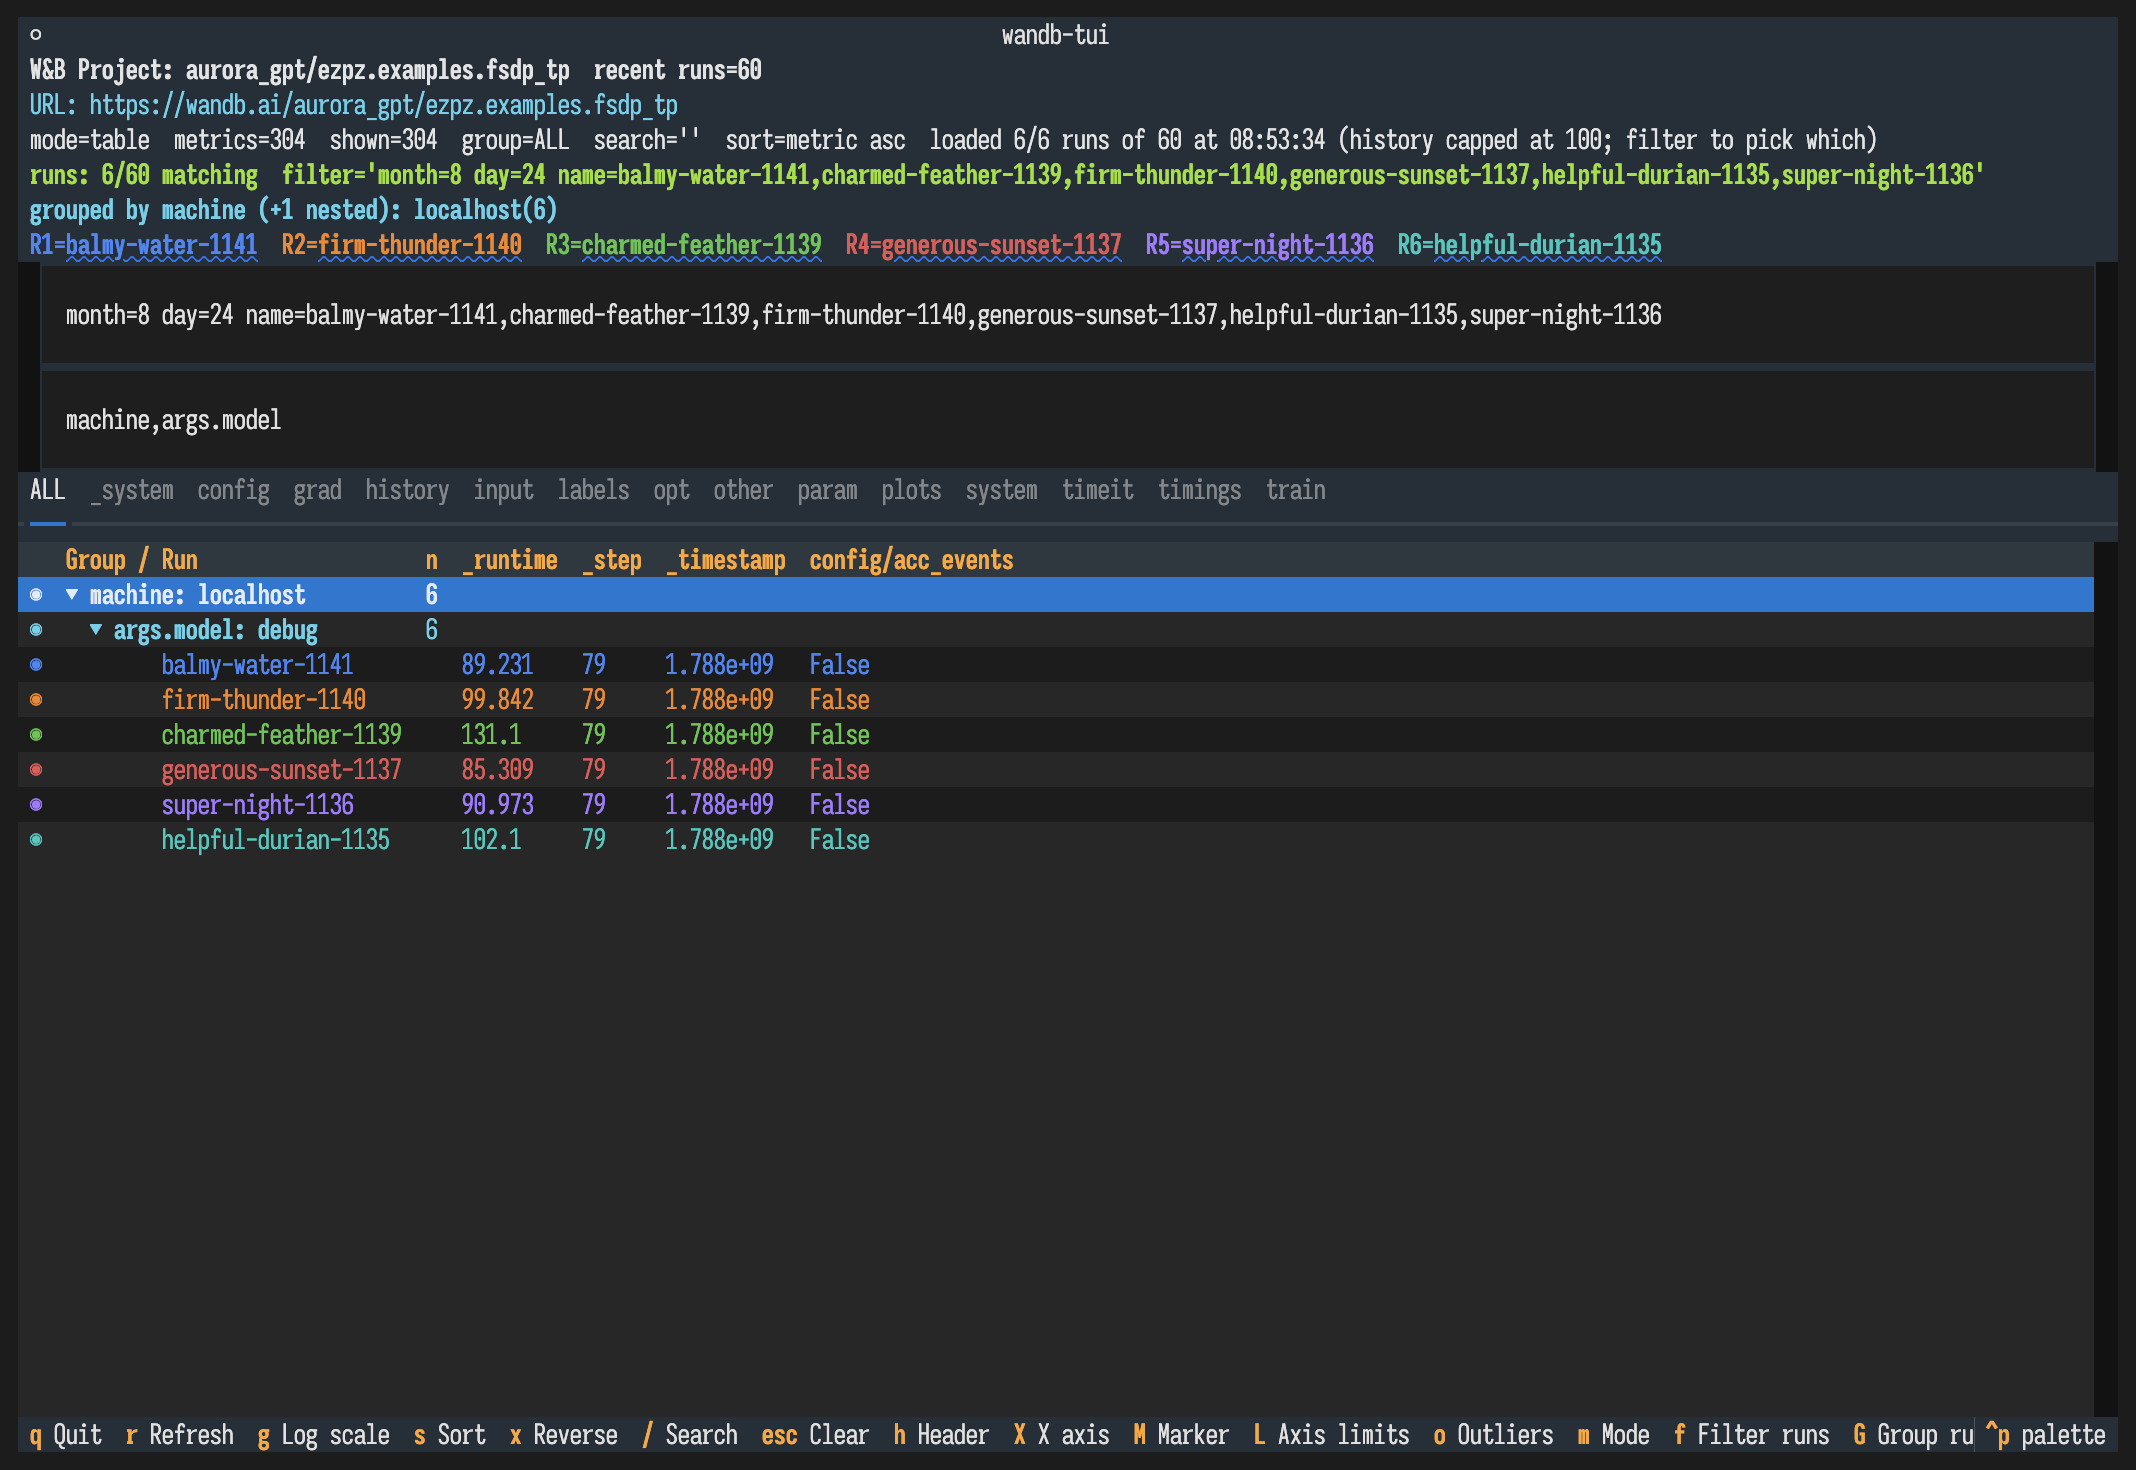
And the comparison table, narrowed by a config filter and a metric search:
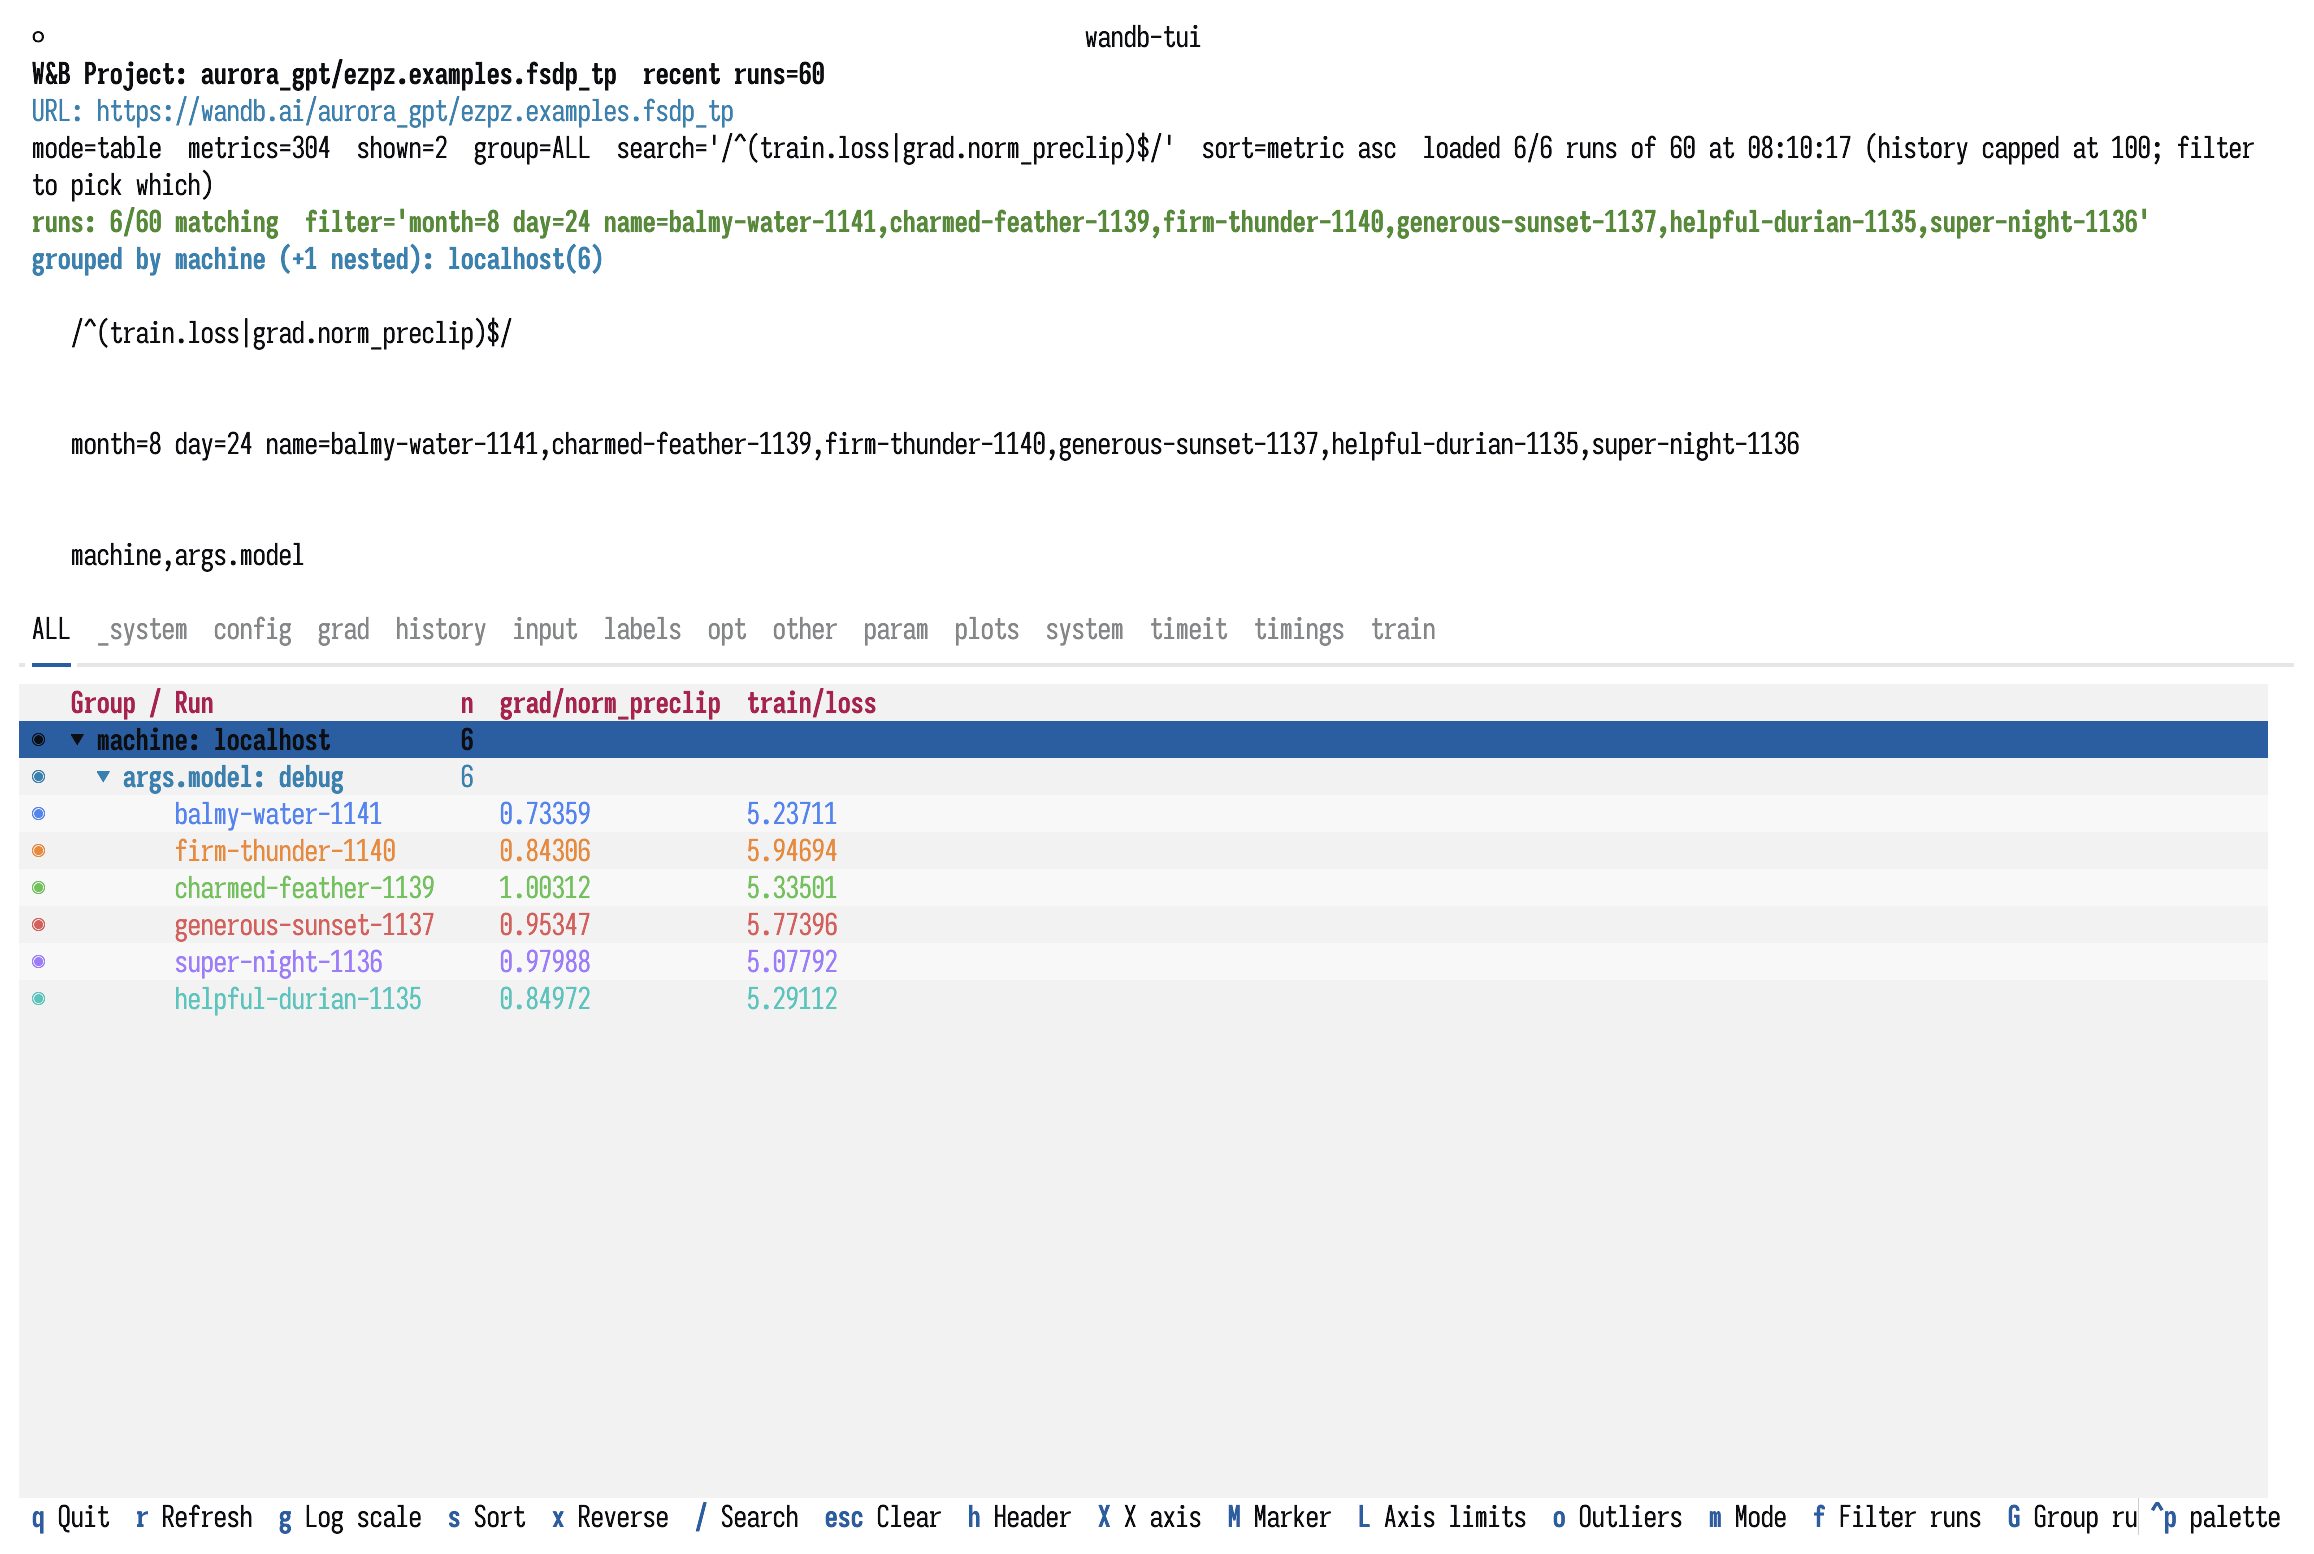
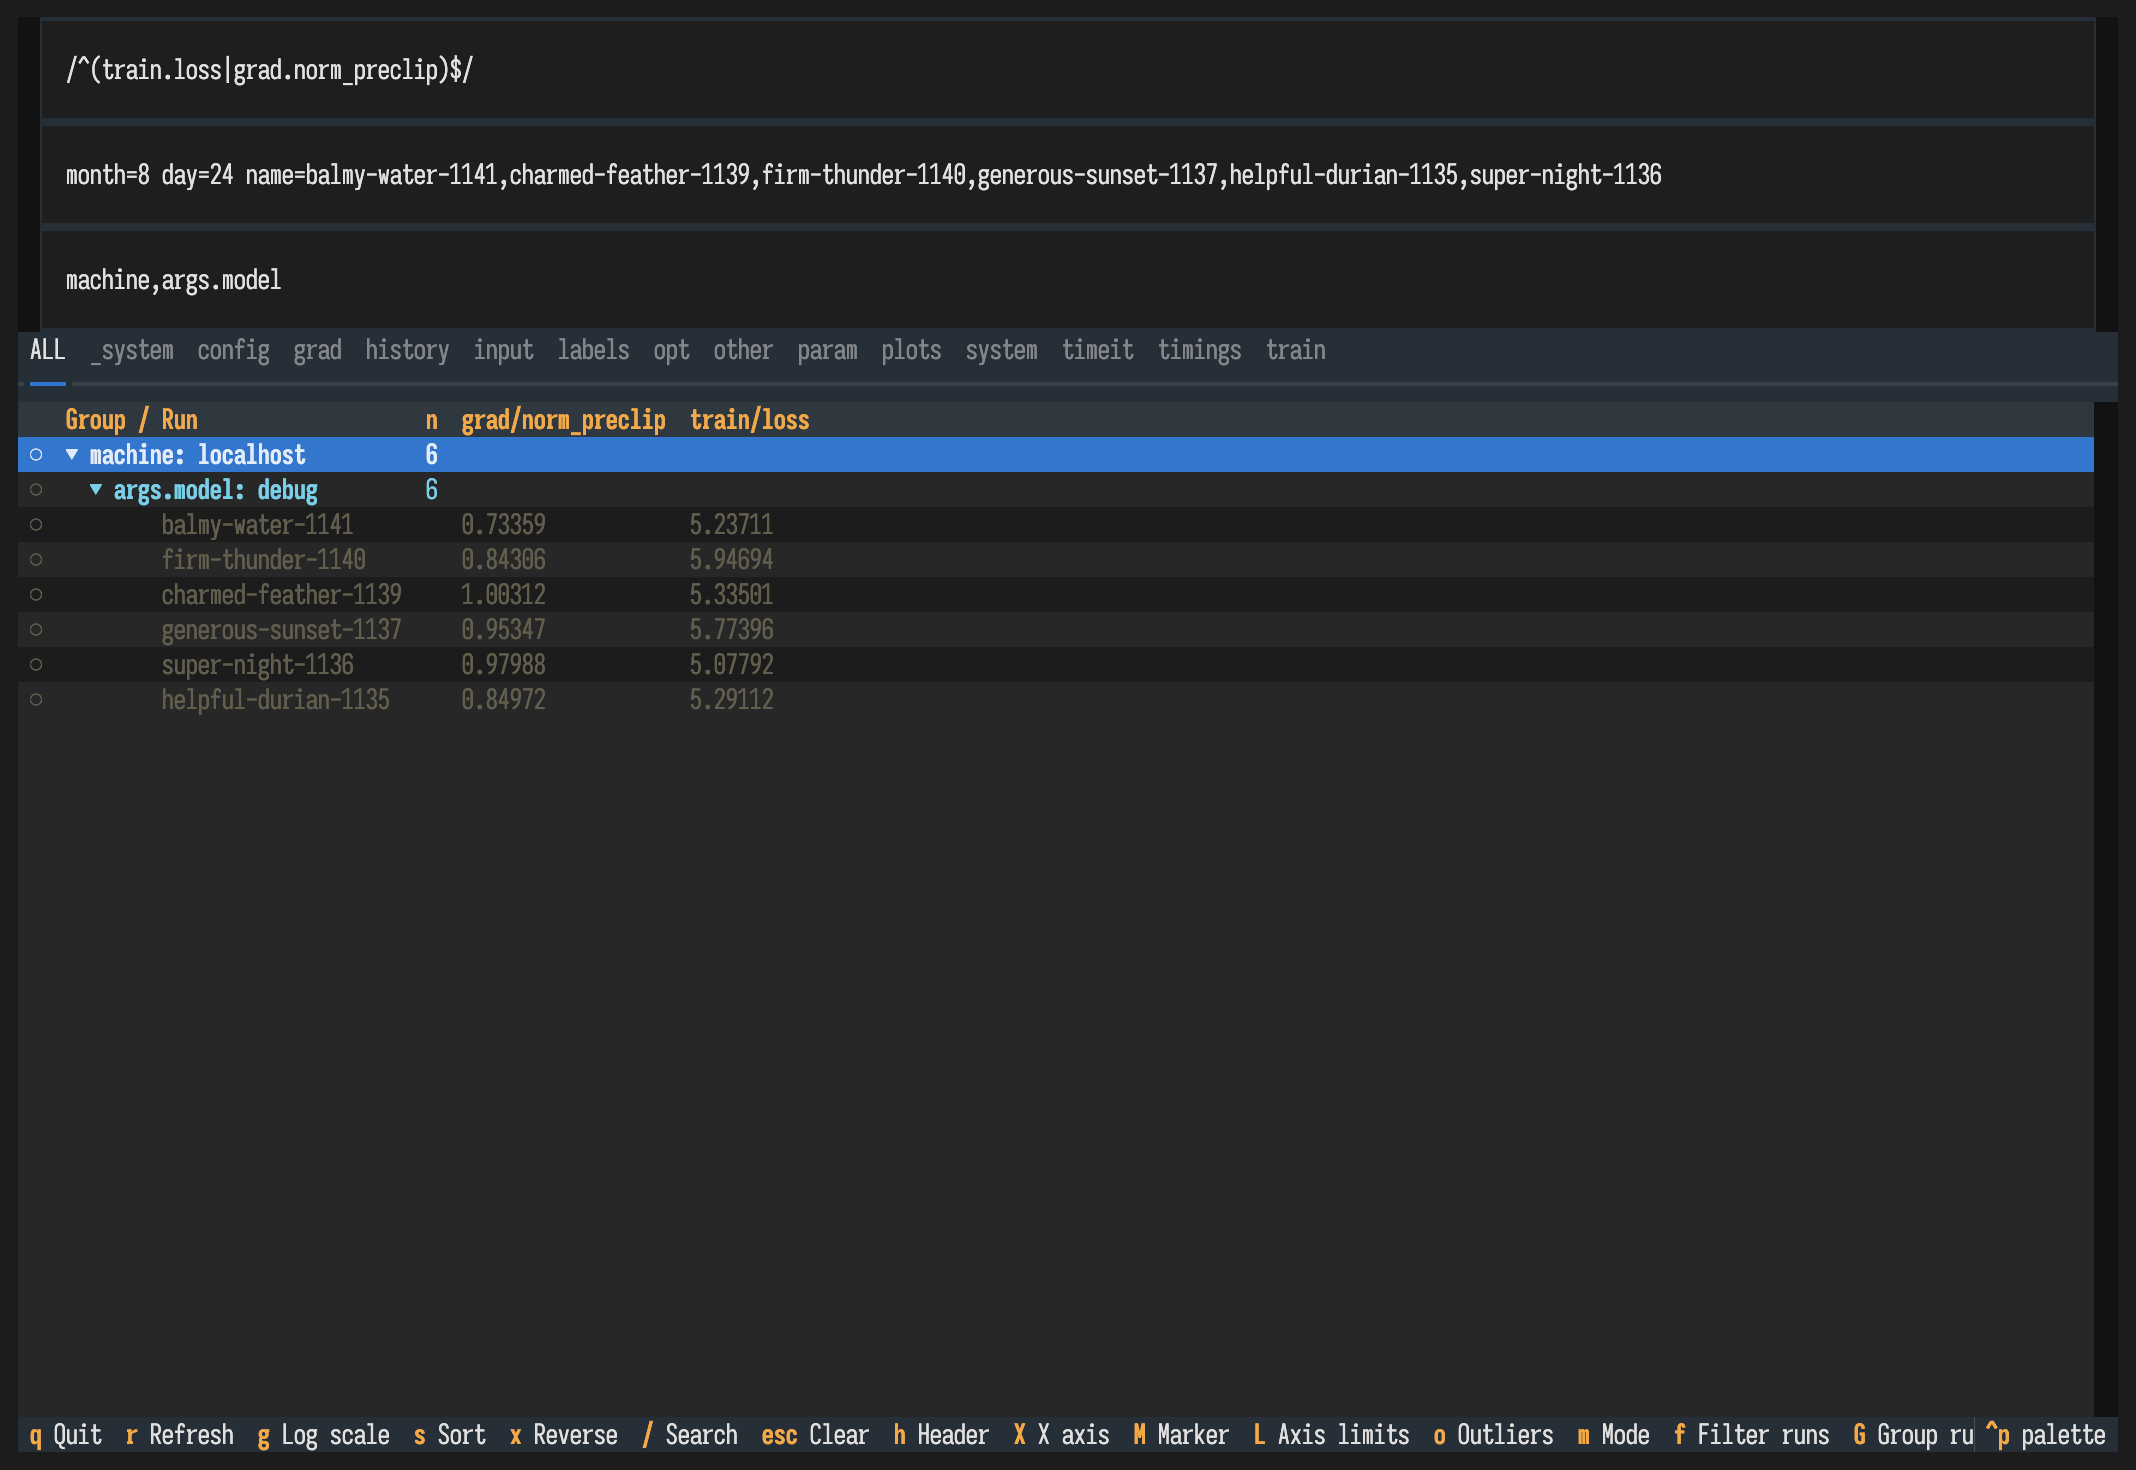
Terminal rendering details that turned out to matter
Two things took disproportionate effort, and both are the kind of thing you only notice when it is wrong.
Marker density is a real tradeoff. M cycles the plot marker. The default
hd packs 2×2 blocks per character cell; braille packs 2×4 dots — more
vertical resolution, but visually lighter and harder to read at a glance on
some fonts. Neither is correct for every chart, so it is a keypress rather than
a setting.
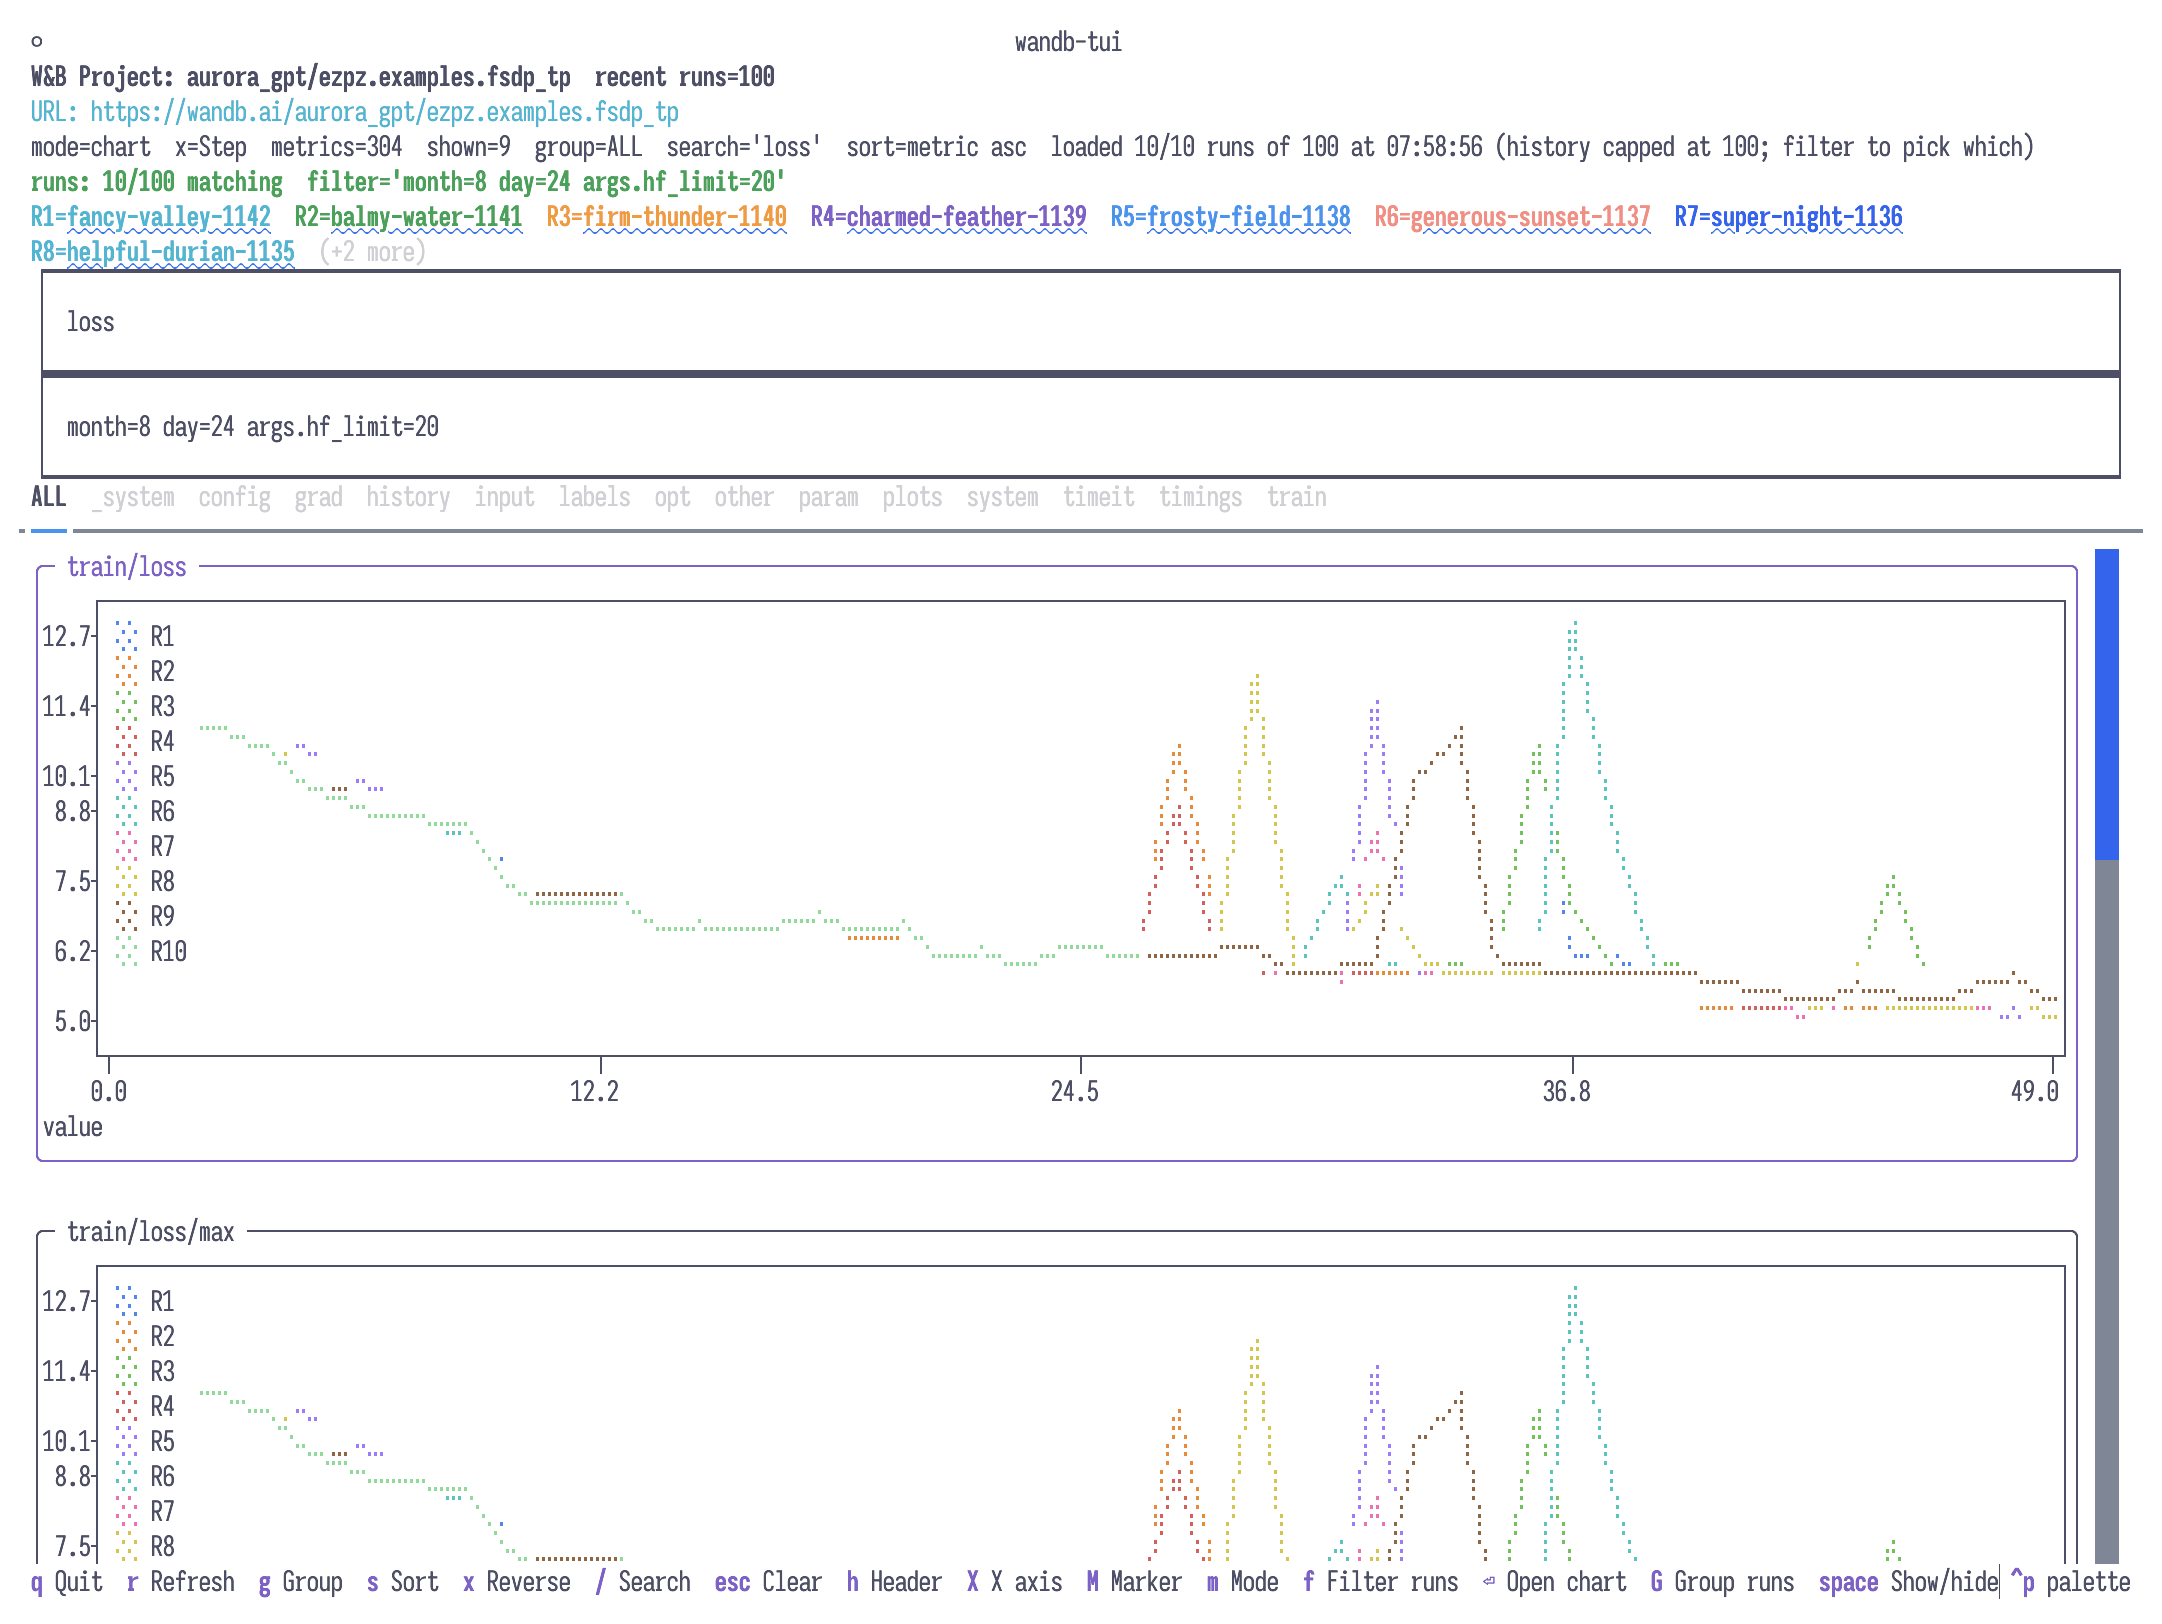
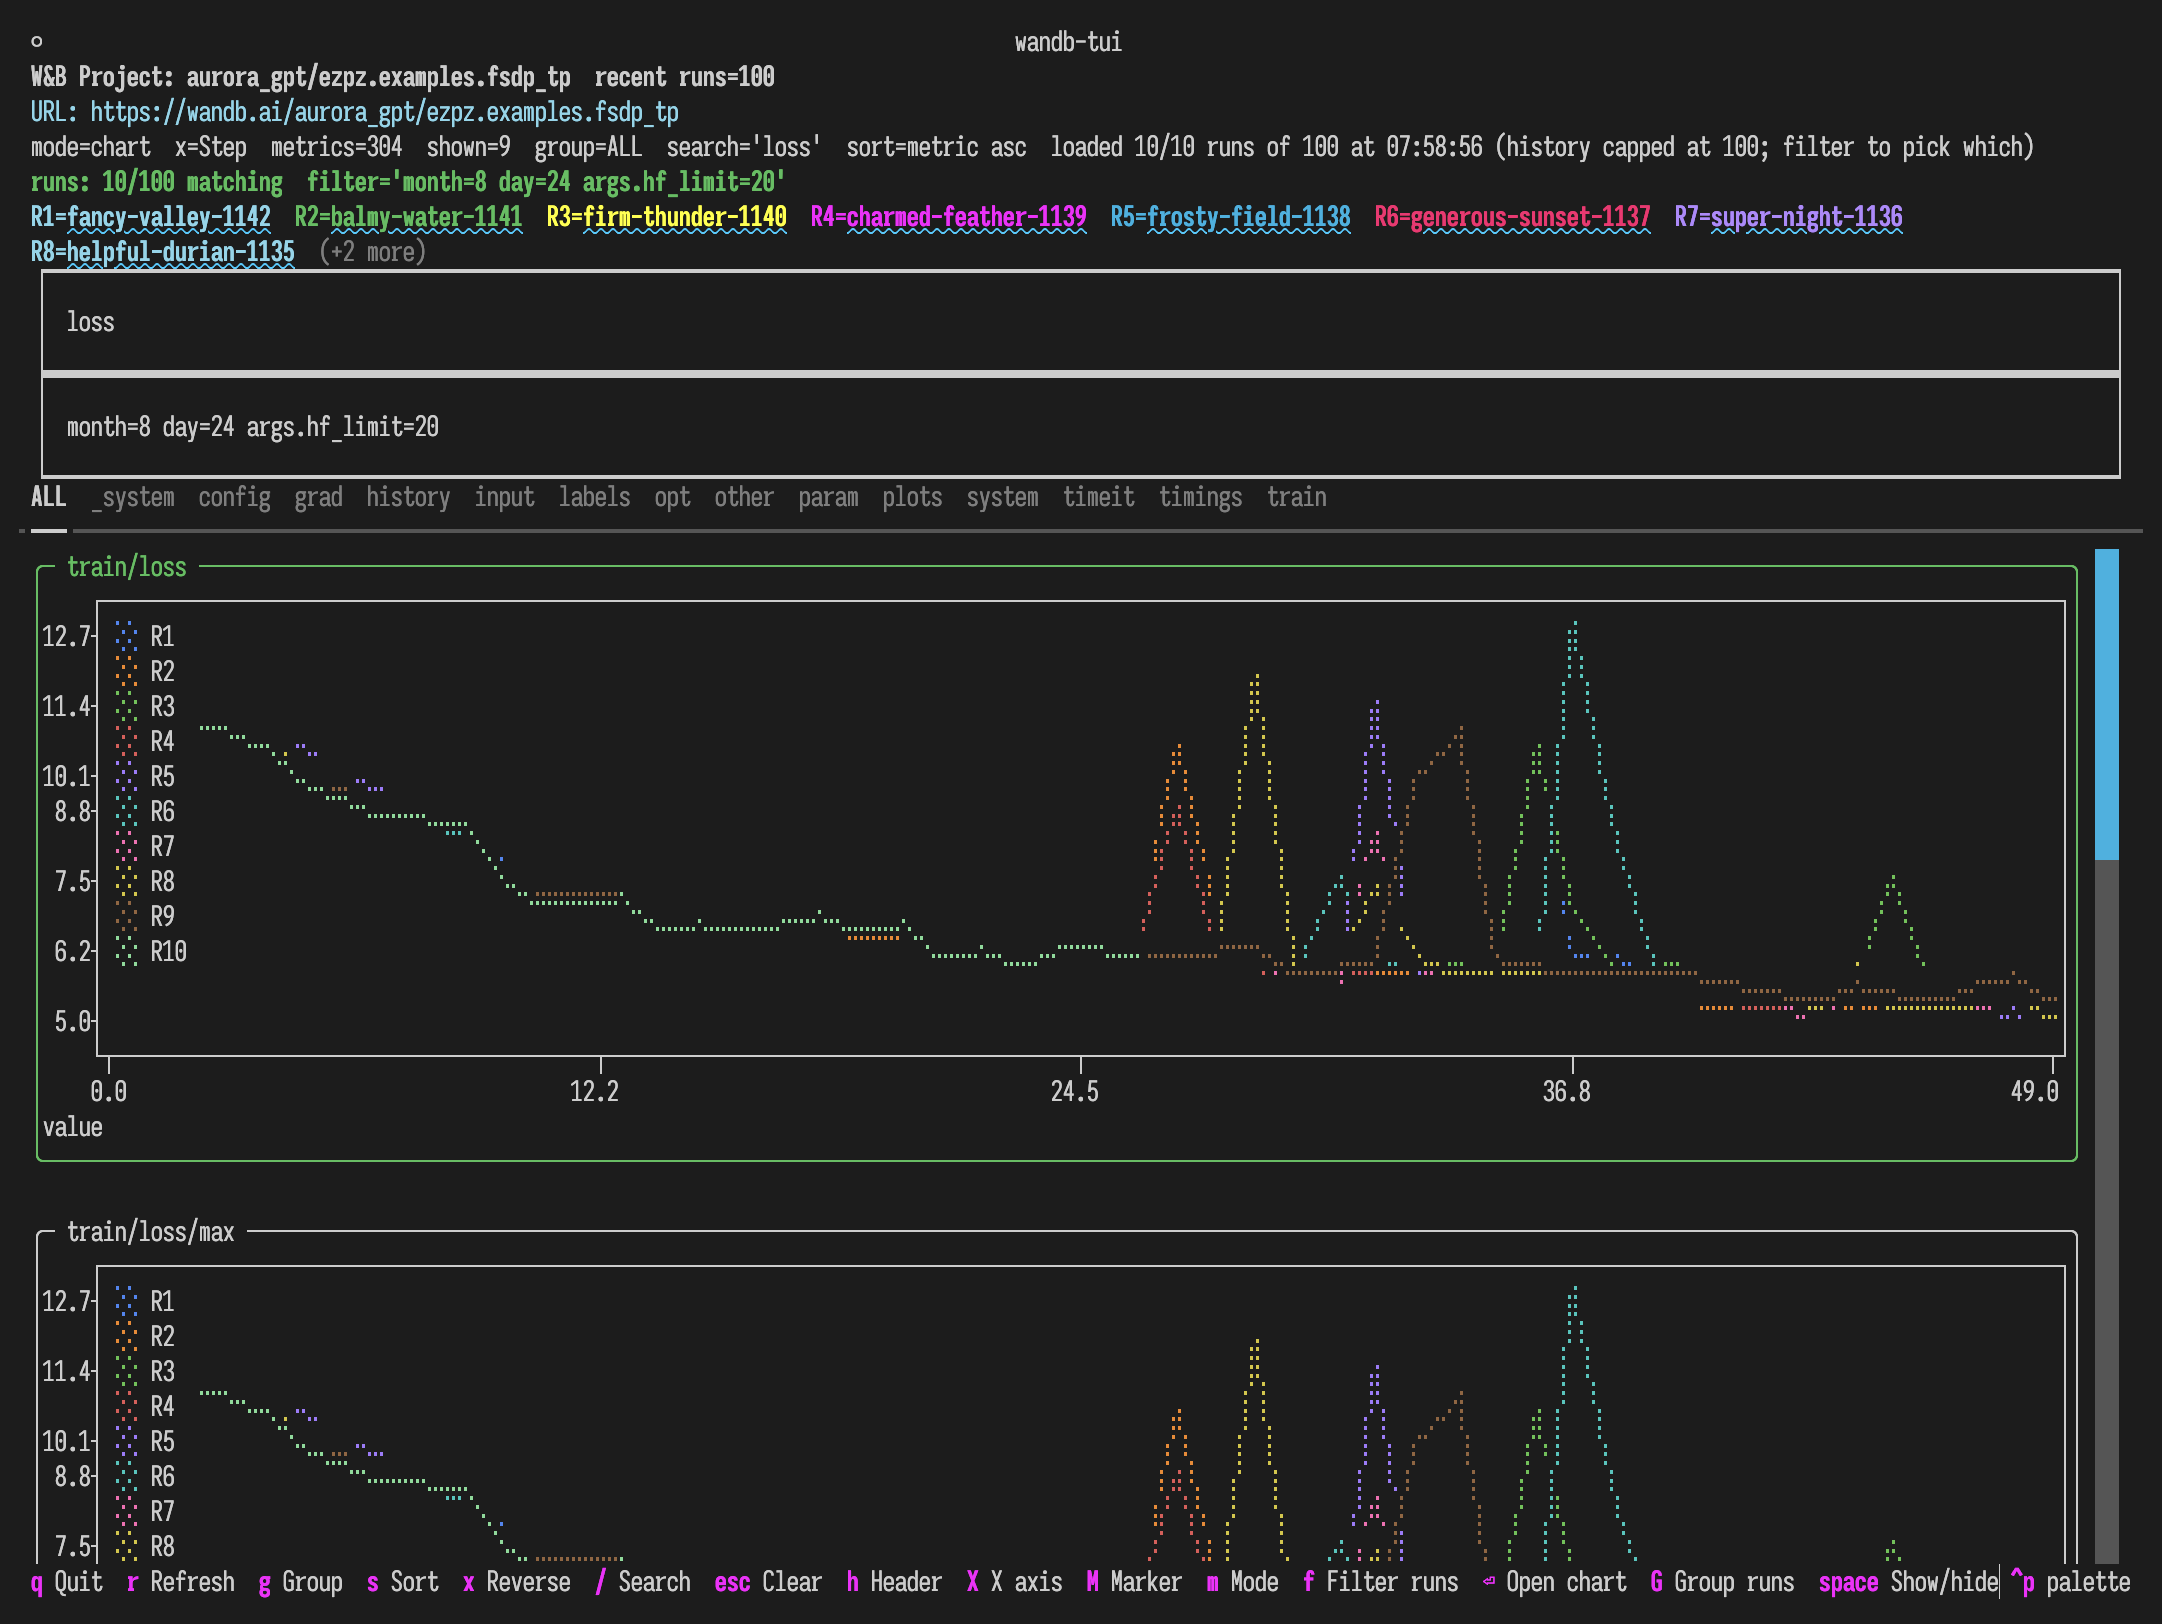
The same charts in braille — compare against the hd grid above.
Following the terminal theme is not optional. An early version painted a dark slab on a light terminal, which looks like a bug even though every pixel is intentional. The TUI now detects the terminal background and uses a matching white theme, so it sits on the page instead of over it. The screenshots in the README do the same thing against your GitHub theme.
Getting started
The startup picker is the fastest path — launch with no arguments and choose an entity, then a project:
uvx wandb-tui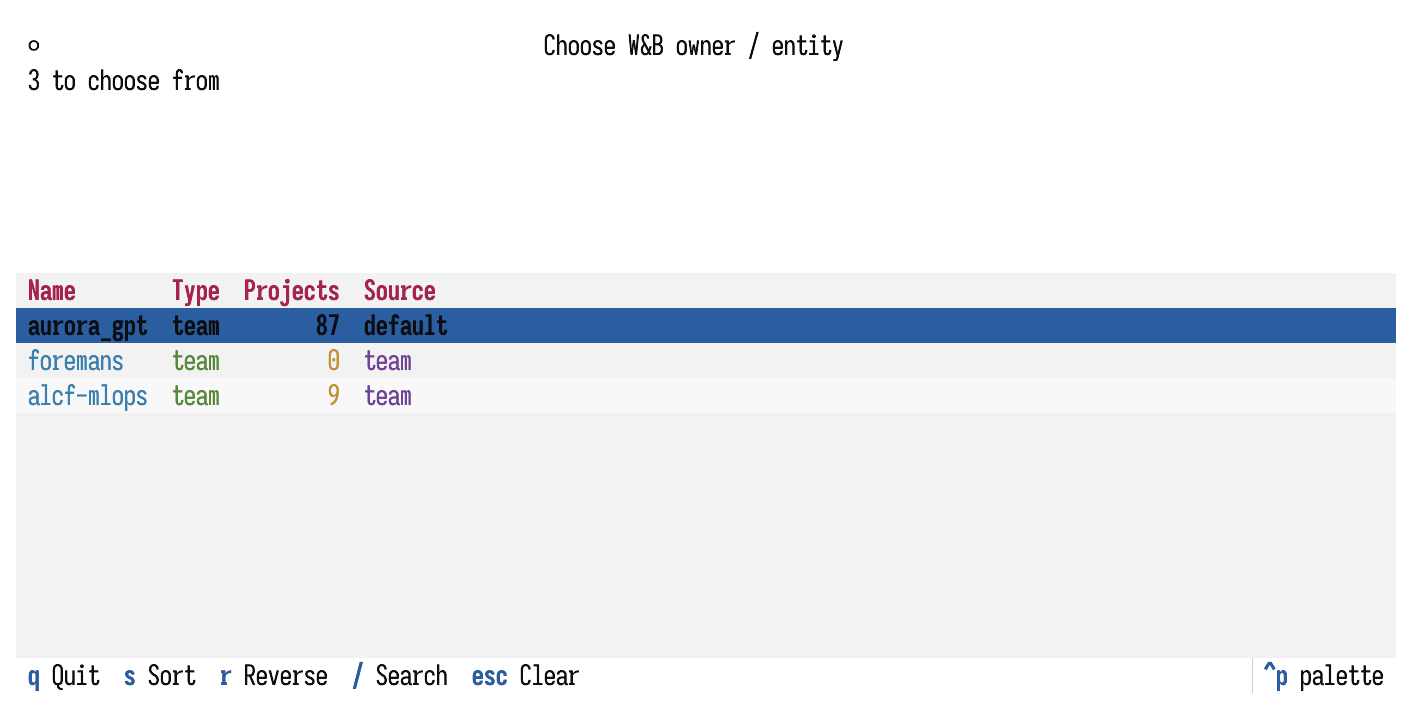

Or go straight to what you want:
# compare the 8 most recent runs in a project
uvx wandb-tui 'https://wandb.ai/<entity>/<project>' --runs 8

# a single run
uvx wandb-tui https://wandb.ai/<entity>/<project>/runs/<run-id>
For scripting, --once prints a table snapshot and exits, and there is JSON
export for downstream analysis:
uvx wandb-tui 'https://wandb.ai/<entity>/<project>' \
  --runs 8 --once --search train/loss
Private projects
Set WANDB_API_KEY before launching. Public runs need nothing — not even
wandb itself installed, since the API is reached directly.
Wrapping up
The useful constraint here was refusing to depend on local run state. Once the input is a URL, the same tool works for a laptop experiment, a job on a cluster you are SSH’d into, and a cloud run you never had a filesystem for — which is most of them.